Introduction
In growing patients with skeletal discrepancies, early diagnosis, evidence-based explanations of etiology, and assessment of functional factors can be vital for the restoration of normal craniofacial growth and the stability of the treatment results. The aims of our study were to compare the 3-dimensional pharyngeal airway volumes in healthy children with a retrognathic mandible and those with normal craniofacial growth, and to investigate possible significant relationships and correlations among the studied cephalometric variables and the airway morphology in these children.
Methods
Three-dimensional airway volume and cross-sectional areas of 27 healthy children (12 boys, 15 girls; mean age, 11 years) were measured by using cone-beam computed tomography volume scans, and 2-dimensional lateral cephalograms were created and analyzed. The subjects were divided into 2 groups based on their ANB angles (group I: 2° ≤ ANB ≤ 5°; group II: ANB >5°), and cephalometric variables, airway volumes, and cross-sectional measurements were compared.
Results
There were statistically significant differences in the following parameters: height of the posterior nasal plane ( P <0.05), pogonion to nasion perpendicular distance ( P <0.01), ANB angle ( P <0.01), mandibular body length ( P <0.01), facial convexity ( P <0.01), and total airway volume ( P <0.05). No statistically significant differences between the 2 groups were found in the cross-sectional area and the volumetric measurements of the various sections of the airway except for total airway volume, which had larger values in group I ( P <0.05).
Conclusions
The mean total airway volume, extending from the anterior nasal cavity and the nasopharynx to the epiglottis, in retrognathic patients was significantly smaller than that of patients with a normal anteroposterior skeletal relationship. On the other hand, differences in volume measurements of the 4 subregions of the airway were not statistically significant between the 2 groups.
The effects of respiratory function on craniofacial growth have been studied for decades, and most clinicians now understand that respiratory function is highly relevant to the orthodontic diagnosis and the treatment plan. In 1907, Angle showed that his Class II Division 1 malocclusion is associated with obstruction of the upper pharyngeal airway and mouth breathing. Clinical features related to impaired breathing have been observed by some authors, and Ricketts presented the main characteristics of the respiratory obstruction syndrome as adenoid and tonsil hypertrophy, crossbite, open bite, narrow external nares, and tongue thrusting.
Predisposing factors of nasal obstruction can include adenoid and tonsil hypertrophy, polyps, allergies, infections, and nasal deformities. A common cause of mouth breathing arises from the adenoids, which are a conglomerate of lymphatic tissues located in the posterior pharyngeal airway. Infection and inflammation of the adenoids leads to upper airway obstruction, and the term “adenoid facies” is often used to describe a possible aberrant craniofacial growth pattern related to mouth breathing characterized by lip incompetency, underdeveloped nose, increased anterior facial height, constricted dental arches, and proclined maxillary incisors with a Class II occlusal relationship.
In addition to studies that affirm nasal obstruction as the major factor responsible for dentofacial anomalies, other studies refute a significant relationship between airway obstruction and the frequency of malocclusion. In a study of 500 patients with upper airway problems, Leech discovered that 60% of the mouth-breathing patients were Class I and concluded that mouth breathing has no influence on craniofacial growth. Similarly, Gwynne-Evans determined that facial growth is constant regardless of the mode of breathing. Additionally, Humphreys and Leighton found no significant difference in the anteroposterior relationship of the jaws between nose and mouth breathers.
In growing patients with skeletal discrepancies and clinical signs of adenoid facies, early diagnosis, evidence-based explanations of etiology, and assessment of the functional factors might be vital for the restoration of normal craniofacial growth and the stability of treatment results. Morphometric evaluation of the pharyngeal airway has been mostly performed on lateral cephalometric headfilms, by identifying specific landmarks and measuring various lengths and areas in the pharyngeal region.
Despite the vast amount of research concerning airway anatomy and its influence on craniofacial growth and development, most studies have been 2-dimensional (2D) and have used lateral or frontal cephalograms with limited evaluation of lengths and areas. New 3-dimensional (3D) technology of computed tomography (CT) has expanded diagnostic capacities, making volumetric analysis and accurate visualization of the airway possible. Most 3D studies of the airway used multislice CT to evaluate the airway; this has the advantage of high-quality images to discern hard- and soft-tissue anatomies, but, because of the high radiation dose, it is restricted to patients with severe craniofacial deformities and those undergoing orthognathic surgeries. Recently, cone-beam CT (CBCT) systems have been developed specifically for the maxillofacial region. Because a CBCT scan uses a different type of acquisition than traditional multislice CT, radiation is reduced and can be used in a wider range of patients, eg, those having maxillofacial surgery, implantology, and orthodontics. Cross-sectional and volumetric investigations of the pharyngeal airway have been possible by using CBCT scans to analyze the complex airway anatomy, and previous studies have confirmed that volumetric measurements of airways with CBCT are accurate with minimal error.
The aims of our retrospective, cross-sectional study were (1) to compare the 3D pharyngeal airway volumes in healthy children with a retrognathic mandible and those with normal craniofacial growth and (2) to investigate possible significant relationships and correlations among the studied cephalometric variables and the airway morphology in these children.
Material and methods
Pharyngeal airway structures were studied in 27 healthy children (12 boys, 15 girls) with a mean age of 11.19 ± 1.28 years ( Table I ) who were referred to the Department of Orthodontics of Kangdong Sacred Heart Hospital, Hallym University Medical Center, Seoul, Korea, for treatment. Those who had symptoms of upper respiratory infection, pharyngeal pathology such as adenoid hypertrophy and tonsillitis or a history of adenoidectomy or tonsillectomy were excluded.
| Group I | Group II | ||||
|---|---|---|---|---|---|
| Male | Female | Male | Female | Total | |
| Subjects (n) | 7 | 7 | 5 | 8 | 27 |
| Age (y) (mean ± SD) | 11.46 ± 0.69 | 11.71 ± 0.86 | 10.23 ± 0.73 | 11.09 ± 1.03 | 11.19 ± 1.28 |
| Range (y) | 10.50-12.58 | 10.67-12.92 | 9.42-12.33 | 9.08-12.17 | 9.08-12.92 |
The study protocol was approved by the Ethics Review Committee of the hospital (IRB 09-57).
CBCT volume scans of all subjects were obtained by using the Master 3D dental-imaging system (Vatech, Seoul, Korea), and the imaging protocol used a 12-in field of view to include the entire craniofacial anatomy. The axial slice thickness was 0.3 mm, and the voxels were isotropic.
Patients sat upright with natural head position, and their jaws were at maximum intercuspation with the lips and tongue in a resting position. The patients were asked not to swallow and not to move their heads or tongues. Almost all 3D imaging modalities (eg, conventional CT or magnetic resonance imaging) require patients to be supine; this causes significant morphologic changes of the airway, since gravity affects the soft tissues surrounding the oropharyngeal cavity. It might be reasonable to examine patients in the supine position for diagnosing such disorders as obstructive sleep apnea. In most cases (including orthodontic diagnosis and treatment planning), however, patients do not need to be analyzed in the supine position. Recent advances in CBCT permit the acquisition of axial CT images in the upright sitting position, which is more valid for our study.
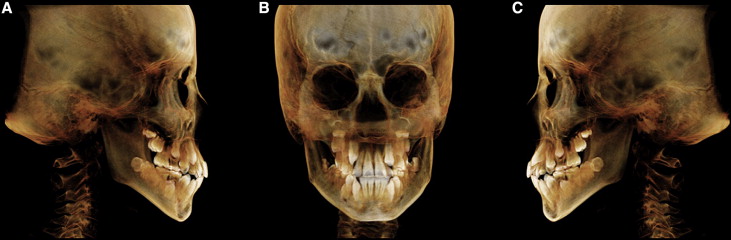
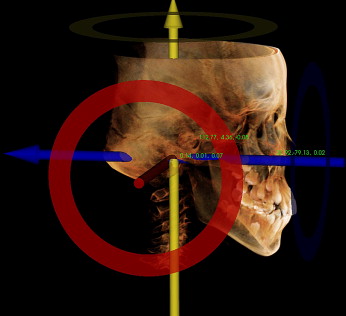
The axial images were imported to InVivoDental software (Anatomage, San Jose, Calif), and volumetric rendering was done for airway and cephalometric analysis ( Fig 1 ). To standardize the measurements and minimize errors, the 3D image was reoriented, by using the Frankfort horizontal (FH) plane as its reference plane. The FH plane was constructed from the right and left porions located in the most laterosuperior point of the external auditory meatus and the right orbitale ( Fig 2 ). Cho proposed a 3D analysis system from a CBCT volumetric image with a set of landmarks, reference lines, and reference planes. In his system, the 3D image is reoriented according to the nasofrontozygomatic plane and the FH plane. Lagravère et al designated reference points such as the midpoint between the foramen lacerum and the middorsum foramen magnum, since they are easily viewed in the 3D images.
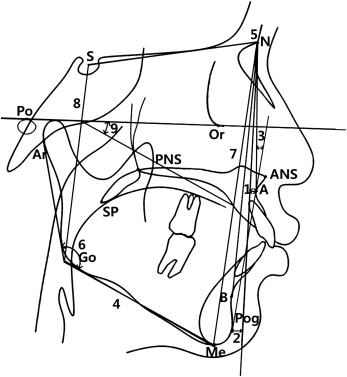
The 2D cephalometric images were derived from the 3D CT scans by creating an orthogonal projection with parallel rays, and the images were imported into V-ceph software (Osstem Implant, Seoul, Korea) for conventional 2D analysis. Landmark identifications and physical measurements were performed by the same investigator (Y.J.K). For the cephalometric analysis, 13 conventional hard-tissue cephalometric landmarks were identified, and 5 anteroposterior and 5 vertical measurements were calculated ( Table II , Fig 3 ). The subjects were assigned to 2 groups based on their ANB angles: 14 subjects (7 boys, 7 girls) whose ANB angles ranged from 2° to 5° were allocated to group I, and 13 subjects (5 boys, 8 girls) who had ANB angles greater than 5° were allocated to group II ( Table I ).
| Variable | Definition |
|---|---|
| Vertical skeletal pattern | |
| Gonial angle | The angle formed by the junction of the posterior and lower borders of the mandible |
| AFH | Distance between nasion and menton |
| PFH | Distance between sella and gonion |
| FMA | The angle formed by the FH plane and the mandibular plane (Go-Me) |
| AFH/PFH | Ratio of AFH to PFH |
| Anteroposterior skeletal pattern | |
| A to N-perp | The linear distance from Point A to nasion perpendicular |
| Pog to N-Perp | The linear distance from pogonion to nasion perpendicular |
| ANB | The difference between SNA and SNB |
| Mn body length | The linear distance of the mandibular plane (Go-Me) |
| Facial convexity | The angle fomed by nasion, Point A, and pogonion |
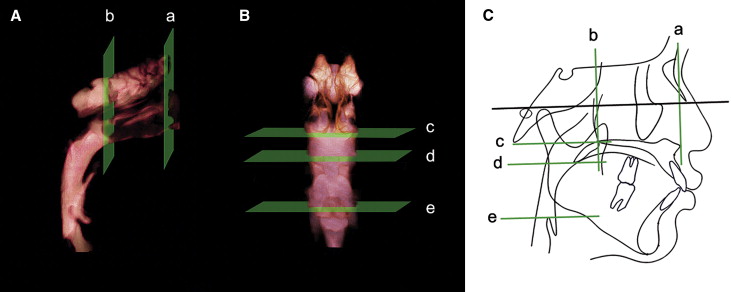
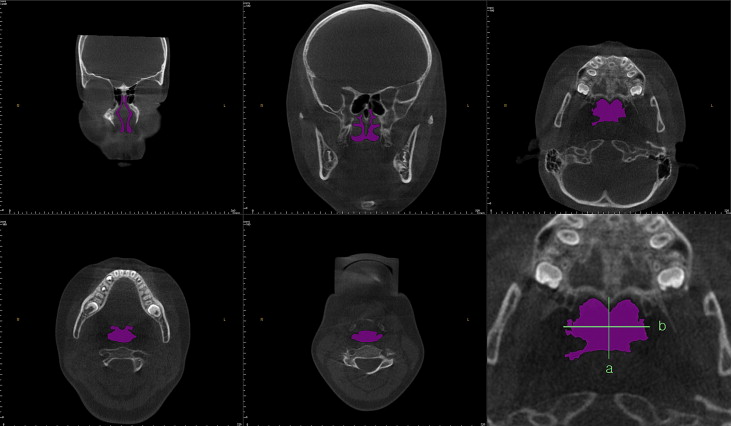
Five cross-sectional planes (2 frontal and 3 axial sections) and 5 volumes of the pharyngeal airway were developed in this study based on the FH plane and soft-tissue landmarks ( Table III ; Figs 4 and 5 ). Cross-sectional planes of the nasal cavity are perpendicular to the FH plane, whereas the pharyngeal cross-sections are parallel to the FH plane. Although these cross-sections are not directly perpendicular to the long axis of the airway, the FH plane was used as a reference plane to standardize the plane orientation and minimize error in identifying the studied cross-sectional planes of the subjects. Various dimensions of the airway were calculated by the same examiner. Cross-sectional measurements including width, length, and area were calculated in the sectional views (frontal and axial) because they provide precise 2D visualization and linear accuracy of 2D measurements ( Fig 5 ).
| Landmark | Definition | |
|---|---|---|
| Cross-sectional plane | ||
| Anterior nasal plane | Ana plane | A frontal plane perpendicular to the FH plane passing through ANS |
| Posterior nasal plane | Pna plane | A frontal plane perpendicular to the FH plane passing through PNS |
| Upper pharyngeal plane | Uph plane | An axial plane parallel to the FH plane passing through PNS |
| Middle pharyngeal plane | Mph plane | An axial plane parallel to the FH plane passing through the caudal margin of the soft palate |
| Lower pharyngeal plane | Lph plane | An axial plane parallel to the FH plane passing through the superior margin of the epiglottis |
| Volume | ||
| Nasal airway | Airway formed by the Ana and Pna planes | |
| Superior pharyngeal airway | Airway formed by the Pna and Uph planes | |
| Middle pharyngeal airway | Airway formed by the Uph and Mph planes | |
| Inferior pharyngeal airway | Airway formed by the Mph and Lph planes | |
| Total airway | Airway extending from Ana plane to Lph plane |
Volumetric renderings of the subjects’ CT scans were acquired with the InVivoDental software, and we proceeded with volumetric analysis of the defined airways. Since airway is void space surrounded by hard and soft tissues, inversion of the 3D-rendered image is required; this converts a negative value to a positive value, and vice versa. This process removes the hard and soft tissues of the image and embodies the airway spaces of the craniofacial region including the paranasal sinuses and other empty spaces. Then sculpting was dpme to isolate the desired airway section by removing unnecessary structures; subsequently, threshold values were adjusted to eliminate imaging artifacts and refine the selected airway region. Finally, the volume of the designated airway was calculated in cubic millimeters.
Lateral cephalometric variables and airway dimensions of 15 randomly selected CT scans were remeasured by the same investigator 2 weeks after the first measurements. A paired t test was used to estimate systemic error, and all measurements were free of systemic error. Random error was estimated by using Dahlberg’s formula (ME 2 = Σd 2 /2 n). Random errors varied from 0.49 to 2.24 mm in linear measurements, from 11.33 to 36.12 mm 2 in area measurements, and from 57.36 to 91.37 mm 3 in volume measurements.
Descriptive statistics including the mean and standard deviation for each group were calculated by using SPSS for Windows software (version 12.0, SPSS, Chicago, Ill). Differences between groups I and II, and between the sexes, were tested by using independent t tests. Pearson’s correlation coefficient test was used to detect any relationship of different parts of the airway and between airway volume and 2D cephalometric variables.
Results
Means and standard deviations for cephalometric, cross-sectional, and volumetric variables were compared by sex; since no sex differences were found in any measurement, the subjects were combined for subsequent analysis. Table IV gives the comparison results of groups I and II. There were statistically significant differences in the following parameters: height of the posterior nasal plane ( P <0.05), pogonion to nasion perpendicular distance ( P <0.01), ANB ( P <0.01), mandibular body length ( P <0.01), facial convexity ( P <0.01), and total airway volume ( P <0.05). According to the lateral cephalometric analysis, group II had retruded mandibles and a greater skeletal anteroposterior discrepancy, as evidenced by the pogonion to nasion perpendicular distance, ANB, and facial convexity values. No statistically significant difference between the 2 groups was found in the cross-sectional area and volumetric measurements of the different parts of the airway. However, total airway volume, which is the sum of the 4 separate volumes of the airway, was significantly greater in group I ( P <0.05). The linear measurements of the cross sections indicated that the height of the posterior nasal plane was the only significant mean found, with greater values in group I ( P <0.05).
| Group I (n = 14) | Group II (n = 13) | Intergroup difference | ||||
|---|---|---|---|---|---|---|
| Mean | SD | Mean | SD | P | ||
| Ana plane | Height | 44.62 | 6.03 | 40.32 | 8.67 | 0.16 |
| Width | 16.48 | 1.55 | 14.91 | 3.07 | 0.11 | |
| Cross-sectional area | 263.51 | 71.47 | 216.92 | 95.07 | 0.17 | |
| Pna plane | Height | 22.15 | 1.17 | 19.42 | 2.01 | 0.03 ∗ |
| Width | 25.85 | 2.14 | 25.40 | 2.25 | 0.61 | |
| Cross-sectional area | 292.93 | 70.77 | 258.04 | 77.46 | 0.24 | |
| Uph plane | Length | 22.98 | 5.61 | 22.45 | 4.64 | 0.79 |
| Width | 29.72 | 5.55 | 28.63 | 5.12 | 0.61 | |
| Cross-sectional area | 494.93 | 159.05 | 467.64 | 161.03 | 0.67 | |
| Mph plane | Length | 18.25 | 5.65 | 15.44 | 4.44 | 0.17 |
| Width | 25.38 | 5.68 | 23.57 | 4.11 | 0.36 | |
| Cross-sectional area | 321.86 | 129.11 | 250.96 | 99.99 | 0.13 | |
| Lph plane | Length | 17.34 | 4.96 | 16.18 | 5.39 | 0.57 |
| Width | 29.63 | 3.12 | 28.72 | 4.14 | 0.53 | |
| Cross-sectional area | 427.68 | 183.11 | 363.66 | 148.17 | 0.34 | |
| Cephalometric analysis | Gonial angle | 125.94 | 5.90 | 125.30 | 5.26 | 0.77 |
| AFH | 116.02 | 5.06 | 111.96 | 6.81 | 0.10 | |
| PFH | 73.09 | 5.61 | 69.32 | 5.49 | 0.10 | |
| PFH/AFH | 0.63 | 0.04 | 0.62 | 0.02 | 0.41 | |
| FMA | 29.72 | 4.05 | 32.22 | 2.25 | 0.06 | |
| Point A to nasion perpendicular | –1.15 | 2.87 | –1.16 | 2.29 | 1.00 | |
| Pogonion to nasion perpendicular | –6.84 | 5.05 | –12.79 | 3.91 | 0.01 ∗ | |
| ANB | 2.42 | 1.10 | 5.85 | 1.15 | <0.01 † | |
| Mandibular body length | 68.22 | 4.99 | 63.10 | 3.03 | <0.01 † | |
| Facial convexity | 5.04 | 3.33 | 12.10 | 3.18 | <0.01 † | |
| Airway volume | Nasal airway | 13479.62 | 2547.12 | 11124.00 | 3302.82 | 0.06 |
| Superior pharyngeal airway | 2620.77 | 899.23 | 2138.38 | 658.27 | 0.13 | |
| Middle pharyngeal airway | 1581.23 | 509.83 | 1402.92 | 662.49 | 0.45 | |
| Inferior pharyngeal airway | 3278.00 | 1101.55 | 2498.77 | 1095.03 | 0.08 | |
| Total airway | 20959.62 | 3611.26 | 17164.08 | 4238.46 | 0.02 ∗ | |
Stay updated, free dental videos. Join our Telegram channel
VIDEdental - Online dental courses


