Introduction
The purpose of this study was to investigate the condyle-fossa relationship, the position of the condyles in their respective mandibular fossae, and the dimensional and positional symmetries between the right and left condyles in a sample with normal occlusion.
Methods
Thirty subjects from 15 to 32 years of age with normal occlusion had computed tomography scans of their temporomandibular joints. The images obtained from the axial slices were evaluated for possible asymmetries in size and position between the condylar processes. The images obtained from the sagittal slices were used to assess the depth of the mandibular fossa, the condyle-fossa relationship, and the centralization of the condyles in their respective mandibular fossae. Paired Student t tests were applied, and Pearson product moment correlations were determined after measurements on both sides were obtained.
Results
The largest mediolateral diameter of the mandibular condylar processes ( P = 0.022) and the posterior joint spaces ( P = 0.048) showed statistically significant differences between the right and left sides. Statistically significant ( P <0.05) anterior positioning of the condyles (noncentralized position) was observed.
Conclusions
No singular characteristic in the temporomandibular joints of the normal occlusion group was verified. The largest mediolateral diameter of the mandibular condylar processes and the posterior joint spaces showed statistically significant differences between the right and left sides. Evaluation of the position of the condyles in their respective mandibular fossae showed noncentralized positioning for the right and left sides.
Morphologic studies on the temporomandibular joint (TMJ) in patients with normal occlusion are rare in the literature. Nevertheless, most studies evaluated asymptomatic TMJ patients and did not address a direct relationship with dental occlusion. Christiansen et al observed in their computed tomography (CT) study that the anterosuperior joint space was smallest in the normal TMJ compared with the superior and posterosuperior joint spaces. To determine ideal condylar position in functionally optimal joints without disc displacement, Ikeda and Kawamura, in a cone-beam CT (CBCT) study, found noncentered condyles, with the posterior joint space larger than the anterior joint spaces.
Katsavrias and Halazonetis suggested that both the condyle and the mandibular fossa differ in shape among patients with various types of malocclusion. However, the influence of occlusion on TMJ morphology is still controversial. Although some studies point to a correlation between occlusal factors and joint morphology, others could not establish a correlation. Opinions also differ as to the importance of occlusion in the condyle-fossa relationship. Studies by Myers et al, Mongini, Mongini and Schmid, Pullinger et al, O’Byrn et al, and Schudy showed significant correlations between these variables. However, Cohlmia et al reported no relationship between them.
Several studies attempted to correlate certain characteristics of the TMJ with specific types of malocclusion. By evaluating the TMJ structures in Class I, Class II, and Class III malocclusions, Burley demonstrated that those malocclusions do not produce functional stimuli capable of altering the articular structures of the temporal bone. No condyle centralization and no statistically significant articular asymmetry in most measurements between right and left sides were found by Vitral et al and Vitral and Telles in a sample of Class II Division 1 subdivision patients, and by Rodrigues et al in samples of Class I, Class II Division 1, and Class III patients. The noncentralization of the mandibular condyles was a characteristic also in other samples of patients with malocclusion.
The use of CT scans in studies on the TMJ was a significant advance in the research of morphology of these structures and the diagnosis of pathologies that are difficult to identify by conventional radiographs. This is the method of choice for obtaining images of bone structures. Additionally, this examination allows real and precise measurements of the structures under analysis. Unfortunately, most traditional CT scanners are large and expensive systems, and are not readily available to orthodontists. Today, with CBCT, these examinations became more accessible to orthodontists, because of more compact equipment that is affordable for small diagnostic centers, and with less radiation than conventional CT scans.
The purpose of this study was to investigate, with CT imaging, the condyle-fossa relationship, the position of the condyles in their respective mandibular fossae, and the dimensional and positional symmetries between the right and left condyles in a sample of subjects with normal occlusion.
Material and methods
After ethical committee’s approval, thirty persons with normal occlusion, ranging in age from 15 to 32 years, had CT scans of their TMJs. All participants met the following requirements: all permanent teeth erupted except third molars, no functional mandibular deviations, no evident facial asymmetry, first molars and canines in a Class I relationship, canine guidance with no working or nonworking side interferences on lateral excursions, anterior guidance with no posterior interferences, normal overbite and overjet, and no crossbite. Patients with temporomandibular disorders were not included in the sample.
The methodology we used was described by Vitral et al and Vitral and Telles.
The CT images were obtained with patients in maximum dental intercuspation, and their heads were positioned so that the Frankfort and midsagittal planes were perpendicular to the floor. The helicoidal, multi-slice CT scan was performed with a Somaton Spirit device (Siemens, Xangai, China) at 120 kV and 160 mA. We obtained 1-mm thick tomographic imaging slices spaced at 1-mm intervals, using the helicoidal technique. Because this procedure provides images in the axial plane, it was reformatted to produce images sagittally. The selected imaging slices were processed in the same equipment.
The measurements were determined by tracing the selected image structures. As in most CT images, the dimensions did not correspond to the real sizes of the structures. Therefore, a scale for measurement conversion was determined for each image. The following measurements were assessed on the sagittal plane.
- 1.
Depth of the mandibular fossa: measured from the most superior point of the fossa to the plane formed by the most inferior point of the articular tubercle to the most inferior point of the auditory meatus ( Fig 1 ).
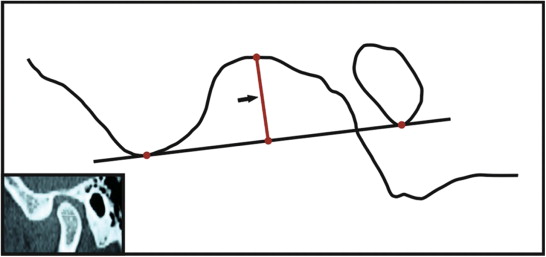
Fig 1 CT image representing the depth of the mandibular fossa. - 2.
Anterior joint space: the shortest distance between the most anterior point of the condyle and the posterior wall of the articular tubercle ( Fig 2 , a ).
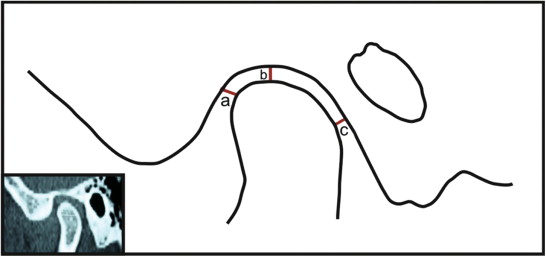
Fig 2 CT image: a , anterior joint space; b , superior joint space; c , posterior joint space. - 3.
Superior joint space: measured from the shortest distance between the most superior point of the condyle and the most superior point of the mandibular fossa ( Fig 2 , b ).
- 4.
Posterior joint space: represented by the shortest distance between the most posterior point of the condyle and the posterior wall of the mandibular fossa ( Fig 2 , c ).
The following measurements were assessed on the axial plane.
- 1.
The largest anteroposterior diameter of the mandibular condylar processes ( Fig 3 , a ).
- 2.
The largest mediolateral diameter of the mandibular condylar processes ( Fig 3 , b ).
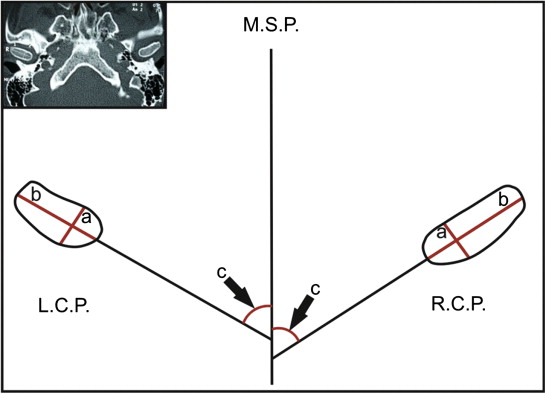
Fig 3 CT image: a , greatest anteroposterior diameter of the mandibular condylar process; b , greatest mediolateral diameter of the mandibular condylar process; c , lateromedial plane angle of the condylar process/midsagittal plane. L.C.P., Left condylar process; R.C.P., right condylar process; M.S.P., midsagittal plane. - 3.
The angle between the long axis of the mandibular condylar process and the midsagittal plane ( Fig 3 , c ).
- 4.
The distance between the geometric centers of the condylar processes and the midsagittal plane, measured with a line that passed through the geometric centers of the condylar processes and perpendicular to the midsagittal plane ( Fig 4 , a ).

Fig 4 CT representations: a , of the distance between the geometric center of the condylar processes to the midsagittal plane; b , anteroposterior difference of the condylar processes. L.C.P., Left condylar process; R.C.P., right condylar process; M.S.P., midsagittal plane. - 5.
The anteroposterior difference between the geometric center of the right and left condylar processes as reflected on the midsagittal plane ( Fig 4 , b ). The point representing the geometric center of the right condylar process was the 0 point. The variations on the left side were measured from this point. The geometric centers situated anterior to the 0 point were considered positive, and those posterior to it were considered negative.
Measurements of the anterior and posterior joint spaces were compared for the right and left sides to evaluate the centralization of the condyles in their respective mandibular fossae.
Paired Student t tests were used for each measurement studied to evaluate the average of differences between the right and left sides for each element of the sample.
Pearson product moment correlation coefficients (r) were determined to quantify the degree of correlation between the values of the right and left sides for each measurement.
Results
The descriptive statistics for each measurement analyzed are shown in Table I . The descriptive statistics for the evaluation of the centralization of the condyles in their respective mandibular fossae are shown in Table II .
| Mean, right side | Mean, left side |
SD, right side | SD, left side | Right side-left side |
P value, paired Student t test |
Pearson product moment correlation (r) |
|
|---|---|---|---|---|---|---|---|
| Depth of mandibular fossa (mm) | 8.43 | 8.46 | 0.59 | 0.72 | −0.03 | 0.803 | 0.025 |
| Anterior joint space (mm) | 1.22 | 1.28 | 0.44 | 0.53 | −0.06 | 0.553 | 0.019 |
| Superior joint space (mm) | 1.67 | 1.66 | 0.62 | 0.66 | 0.01 | 0.903 | 0.000 |
| Posterior joint space (mm) | 1.96 | 1.76 | 0.69 | 0.62 | 0.20 | 0.048 | 0.000 |
| Anteroposterior diameter of condylar process (mm) | 9.93 | 10.13 | 1.24 | 1.30 | −0.20 | 0.283 | 0.000 |
| Mediolateral diameter of condylar process (mm) | 22.57 | 21.92 | 2.65 | 3.09 | 0.65 | 0.022 | 0.000 |
| Angle, condylar process/midsagittal plane (°) | 68.45 | 68.66 | 8.83 | 7.72 | −0.21 | 0.875 | 0.000 |
| Anteroposterior difference of condylar process (mm) | 0.00 | 0.58 | 0.00 | 2.82 | −0.58 | 0.277 | |
| Distance, condylar process/midsagittal plane (mm) | 56.31 | 55.95 | 3.23 | 3.87 | 0.36 | 0.367 | 0.000 |
Stay updated, free dental videos. Join our Telegram channel
VIDEdental - Online dental courses


