Introduction
The purpose of this research was to determine the accuracy of digital models generated by cone-beam computed tomography and compare it with that of OrthoCAD models (Cadent, Carlstadt, NJ) for orthodontic diagnosis and treatment planning by using surface area analysis.
Materials
Two sets of maxillary and mandibular digital models of 30 subjects were obtained. The models were made from impressions scanned with OrthoCAD and by conversion of related cone-beam computed tomography files. Each patient’s matched pairs of maxillary and mandibular models were superimposed by using a software program and a best-fit algorithm; surface-to-surface analysis was then performed. The average linear differences between the 2 files at all points on the surfaces were measured, and tolerance levels of 0.25, 0.5, 0.75, 1.0, 1.25, and 1.5 mm were set to determine the surface correlation amounts between the 2 files. Additionally, 6 linear measurements from predetermined landmarks were also measured and analyzed.
Results
The average maxillary model linear difference was 0.28 to 0.60 mm, whereas the average mandibular model linear difference ranged between 0.34 and 0.61 mm. Greater than a 90% surface correlation was obtained on average at 1.00 mm in the maxillary models and at 1.25 mm in the mandibular models. The mean differences obtained from the linear measurements of the maxillary and mandibular models were 0.071 and 0.018 mm, respectively.
Conclusions
Surface-to-surface analysis of OrthoCAD and digital models generated by cone-beam computed tomography pointed to a fair overlap between the protocols. The accuracy of digital models generated by cone-beam computed tomography is adequate for initial diagnosis and treatment planning in orthodontics.
A comprehensive and accurate treatment plan can be possible only by a thorough evaluation of dental models, intraoral and extraoral photographs, and panoramic and cephalometric images. Recent advances in digital technology have vastly improved the diagnostic phase of orthodontic treatment, and analog records have quickly been replaced by digital formats. The digital alternative offers a great advantage when contemplating the storage space required for traditional plaster models. Digital models can be stored virtually instead of physically, thus reducing the need for storage space along with reducing the costs involved.
Advances in technology and software have allowed digital models to be generated from cone-beam computerized tomography (CBCT) scans. Acquired digital imaging and communications in medicine (DICOM) files captured by the orthodontist can be uploaded to a company’s Web site, and a digital model can be obtained from the file. Once the model is generated by the proprietary software, the orthodontist can download, view, manipulate, and evaluate the models using software provided by the company. This technology allows for all anatomic structures from the CBCT image captured during the scan to be viewed. For example, roots of teeth, temporomandibular joint structures, impacted teeth, and bone levels are all visible. The practitioner can view, evaluate, and manipulate the models and bases alone without any accompanying bony structures. However, the disadvantages to this approach are the lack of gingival tissues in the digital models and concern about possible unnecessary overexposure to radiation.
Cone-beam technology is at the forefront of digital radiography, and generating digital models for diagnostic purposes from this information is a potential advancement that will help in the digitization of the orthodontic office. However, digital models offer an advantage over plaster models only if they are proven to be as accurate for the diagnostic phase of treatment. A recent study showed that space analysis on OrthoCAD digital models (Cadent, Carlstadt, NJ) is clinically acceptable and reproducible when compared with traditional plaster study model analyses. Fleming et al concluded that, overall, the absolute mean differences between direct and indirect measurements on plaster and digital models were minor and clinically insignificant. The accuracy from linear measurements obtained from study casts generated by CBCT was also considered adequate for initial diagnosis and treatment planning in orthodontics, as shown elsewhere.
Validation of surface characteristics of digital models might particularly be important when considering various appliance designs used in clinical applications. The purpose of this study, therefore, was to examine the accuracy of digital models generated by CBCT compared with OrthoCAD digital models by using surface area shell analysis of stereolithography files.
Material and methods
Thirty subjects were included in the study. Two sets of maxillary and mandibular digital models were obtained from them by scanning impressions with OrthoCAD and conversion of their CBCT files with Anatomage software (Anatomage, San Jose, Calif). All subjects were in the permanent dentition and had their impressions and baseline CBCT images obtained at the time of initial records for diagnosis and treatment planning at the Department of Orthodontics, School of Dentistry, University of Texas Health Science Center at Houston.
A Galileos Comfort x-ray unit (Sirona Dental Systems, Bensheim, Germany) was used to capture the CBCT images. With 200 exposures from a 14-second cycle in a 220° segment, a high level of detail from a 15 × 15 × 15-cm volume capture image, and a large dental volume ranging from the tip of the nose to the chin and the mandibular joints, the cone-shaped cone-beam radiation beams of the Galileos x-ray detector allowed for small-region close-up views at double the detail without an additional scan. Image reconstruction time was approximately 4.5 minutes, and voxel size was 0.30 mm.
The CBCT images were uploaded to Anatomage and digitally reformatted to include volume rendering and image conversion. After this conversion, the 3-dimensional digital models were available for downloading from the server.
The OrthoCAD models were obtained from the maxillary and mandibular impressions taken with Identic alginate (Dux Dental, Oxnard, Calif), along with bite registrations taken with polyvinylsiloxane material (Blue Moose, Parkell, Edgewood, NY). After disinfection, the records were placed in sealed plastic bags and mailed to OrthoCAD. Once received, poured, and digitized, the OrthoCAD digital models were available for download from the company’s Web site.
Stereolithography files were obtained from both the CBCT and the scanned impressions. This is a file format native to the stereolithography computer-aided design software created by 3D Systems (Rockhill, SC). In this study, Stereolithography files were required for both digital formats because the surface shapes and volumes were analyzed.
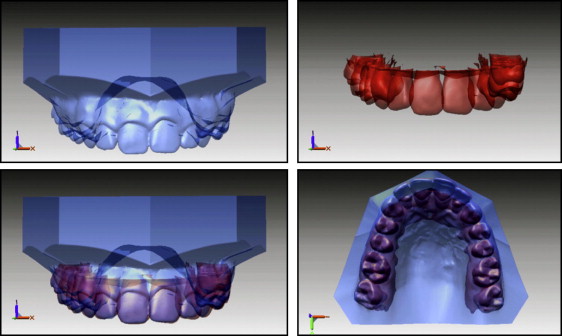
Stereolithography files or shells were opened in the Rapidform software program (Inus Technology, Seoul, South Korea) for surface-to-surface analysis. In Rapidform, the stereolithography files from the CBCT were cropped to remove hard tissue, leaving as much tooth structure as possible above the alveolar bone crest. The OrthoCAD stereolithography files were also cropped to remove as much gingival tissue as possible. The cropped stereolithography files from both the CBCT scans and OrthoCAD were then superimposed, and the Rapidform software obtained a best-fit from the 2 files ( Fig 1 ). Once superimposed, a surface-to-surface analysis was performed to compare the accuracy of the CBCT-generated digital models with the OrthoCAD digital models. This analysis averaged the linear differences between the 2 files at all points on the surfaces.
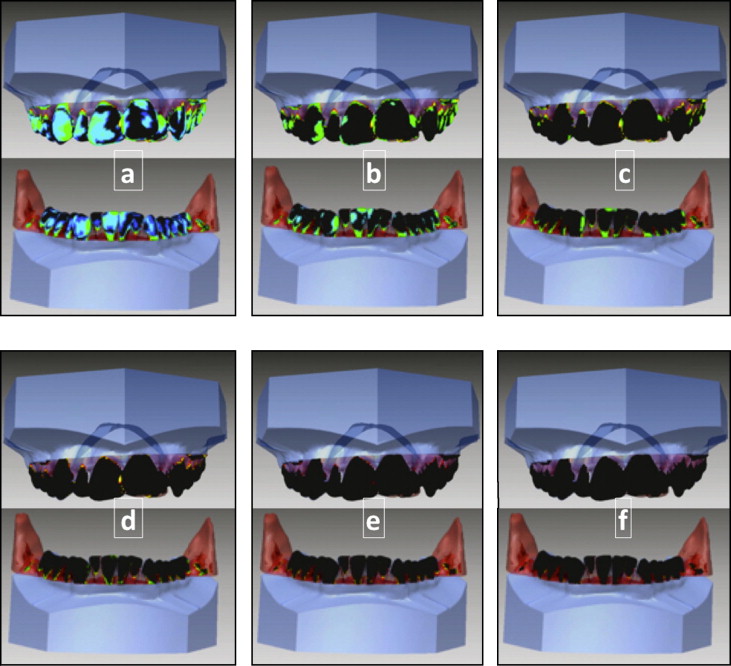
For this study, tolerance levels were set to visualize the discrepancies between the 2 files that fell outside the set tolerance levels. The tolerance levels used in the study were 0.25, 0.5, 0.75, 1.0, 1.25, and 1.5 mm ( Fig 2 ). During the visualization process, a linear difference less than the tolerance level appeared black on the superimposed image, and a linear difference greater than the tolerance level appeared as a color on a scale depending on the amount of the difference. Thus, black on the scale indicated that the linear difference fell within the tolerance range, and the colored regions on the scale indicated that the linear difference fell outside the tolerance level; blue was the most correlated, and red was the least. Mean differences at each tolerance level were recorded and compiled. In addition, the total surface areas corresponding to the tolerance levels were recorded as percentages.
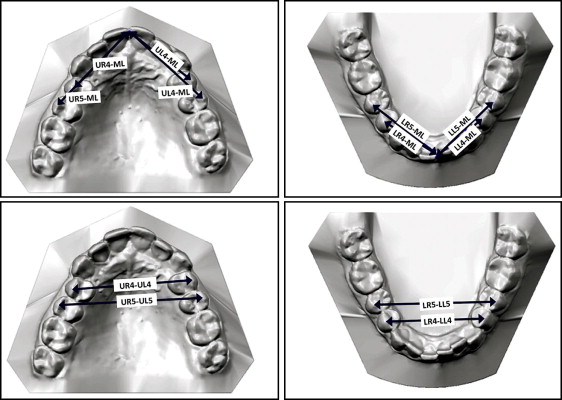
Six linear measurements ( Fig 3 ) were made on each maxillary and mandibular model. The digital models by Anatomage were measured by using the proprietary software, InVivoDental, and the OrthoCAD models were measured by using the OrthoCAD proprietary software , OrthoCAD. Definitions of the linear measurements are summarized in Table I .
| Maxillary cast measurements | |
|---|---|
| UR4-UL4 | Buccal cusp tip of the upper right first premolar to the same point on the upper left first premolar |
| UR5-UL5 | Buccal cusp tip of the upper right second premolar to the same point on the upper left second premolar |
| UR4-ML | Buccal cusp tip of the upper right first premolar to the maxillary midline |
| UR5-ML | Buccal cusp tip of the upper right second premolar to the maxillary midline |
| UL4-ML | Buccal cusp tip of the upper left first premolar to the maxillary midline |
| UL5-ML | Buccal cusp tip of the upper left second premolar to the maxillary midline |
| Mandibular cast measurements | |
|---|---|
| LR4-LL4 | Buccal cusp tip of the lower right first premolar to the same point on the lower left first premolar |
| LR5-LL5 | Buccal cusp tip of the lower right second premolar to the same point on the lower left second premolar |
| LR4-ML | Buccal cusp tip of the lower right first premolar to the mandibular midline |
| LR5-ML | Buccal cusp tip of the lower right second premolar to mandibular midline |
| LL4-ML | Buccal cusp tip of the lower left first premolar to the mandibular midline |
| LL5-ML | Buccal cusp tip of the lower left second premolar to mandibular midline |
Statistical analysis
Intraclass correlation coefficients were calculated for the measurements obtained from maxillary and mandibular OrthoCAD and CBCT-generated models to test the reliability of the CBCT-generated models. IBM SPSS Statistics (version 19; IBM, Armonk, NY) was used to analyze the data. To further graphically display the levels of error between the 2 techniques, Bland-Altman analysis was performed by using XLSTAT Mac (version 2011; Addinsoft, New York, NY).
Results
The average maxillary linear differences between the CBCT-generated and the OrthoCAD models were 0.28 to 0.60 mm, with a median of 0.36 mm. The average mandibular linear difference range between the CBCT-generated and the OrthoCAD models was 0.34 to 0.61 mm, with a median of 0.44 mm ( Table II ).
| Maxillary casts | Mandibular casts | |||
|---|---|---|---|---|
| Average distance (mm) | SD | Average distance (mm) | SD | |
| Low | 0.28 | 0.25 | 0.34 | 0.30 |
| High | 0.60 | 0.39 | 0.61 | 0.59 |
| Median | 0.36 | 0.32 | 0.44 | 0.43 |
The results of the surface overlap for the maxillary and mandibular models in each tolerance level are presented in Table III . The average overlap of the surfaces for the maxillary models ranged from 45.76% at 0.25 mm of tolerance to 99.59% at 1.50 mm of tolerance. The average for the mandibular models ranged from 42.51% at 0.25 mm to 94.85% at 1.50 mm.
Stay updated, free dental videos. Join our Telegram channel
VIDEdental - Online dental courses


