Introduction
The aim of this study was to evaluate the reliability of newly developed software in the assessment of orthodontic tooth movement 3 dimensionally.
Methods
The sample consisted of pretreatment and posttreatment computed tomography scans and plaster dental models of 20 orthodontic patients treated with a hyrax palatal expander as a part of their comprehensive orthodontic treatment. Dental-arch measurements, including arch widths, tooth inclinations, and angulation parameters, were measured on the scans using InvivoDental 3D imaging software (version 5.1; Motionview, Hixson, Tenn). The plaster dental models were laser scanned and superimposed, and measurements were obtained digitally using the new software. Agreement between the digital models and the computed tomography measurements was evaluated with intraclass correlation coefficients, paired t tests, and Bland-Altman plots. A P value of ≤0.05 was considered statistically significant.
Results
High agreement, a nonsignificant paired t test, and no indication of agreement discrepancies were observed for most of the measured parameters.
Conclusions
The results confirmed that the new software program offers a reliable tool for dental-arch measurements obtained from 3-dimensional laser-scanned models.
Highlights
- •
OrthoMechanics Sequential Analyzer software is a noninvasive and nonradiation exposure method.
- •
It is reliable for dental-arch measurements obtained from 3-dimensional laser-scanned models.
The assessment of orthodontic tooth movement has always been of great interest to dental clinicians and orthodontists. The magnitude of tooth movement depends mainly on the amount, duration, and direction of the force applied, the conditions of the bones and periodontal tissues, and the moment-to-force ratio. Currently, methods of evaluating orthodontic tooth movement in 3 dimensions include imaging modalities such as cephalograms, computed tomography (CT), and cone-beam CT (CBCT) and the assessment of study models obtained from laser or CT scanning. Using either CT or CBCT images not only causes radiation exposure, but also has other limitations when considered for the assessment of orthodontic tooth movement. In addition, the metallic components of the orthodontic appliances in the patient’s mouth cause image distortion, which is a major drawback. The literature has also reported many previous attempts to assess tooth movement 3 dimensionally such as 3-dimensional (3D) cephalometric radiographs, 3D occlusograms, infrared photograms, holograms, and stereolithographs. However, most of these attempts proved to be inconvenient for regular or routine use for assessing orthodontic tooth movement.
Digital orthodontic models were introduced with the potential of replacing plaster models as an accurate and efficient patient record. Using digital models facilitates the diagnosis and treatment planning process because they offer clinicians many advantages, such as easy retrieval and transfer of information; easy manipulation to record measurements of teeth, arch sizes, and dental crowding; accurate diagnostic setups of several extraction patterns; and simple documentation of treatment progress and communications. In addition, it is an integral part of the future “paperless, plasterless office,” eliminating the need for storage space and undue office management. Digital models are also used for the production of laboratory appliances and computer-aided bracket placement as well as for virtual treatment simulation.
Studies have reported that linear and angular measurements on 3D digital model superimpositions are reliable compared with plaster models. The purpose of this study was to test the reliability and validity of newly developed software in the assessment of tooth movement 3 dimensionally. Measurements (tipping, torquing, angular, and linear parameters) obtained digitally with the new software were compared with those obtained from the CT scans.
Material and methods
The sample for this retrospective study included the pretreatment and posttreatment CT images and the 3D digital maxillary dental models of 20 orthodontic patients with transverse maxillary deficiency. The patients’ ages ranged from 8 to 15 years (mean, 12.3 ± 1.9 years). They were treated with rapid maxillary expansion with the hyrax appliance as part of their comprehensive orthodontic treatment. Models included in the study had no gross dental abnormalities or obvious distortions. Models of surgically assisted palatal expansion patients were excluded to be able to use the model’s incisive papilla and midpalatal raphe as reference landmarks for superimposing the laser-scanned pretreatment and posttreatment models. We used a sample that was previously collected and approved by the Indiana University institutional review board committee.
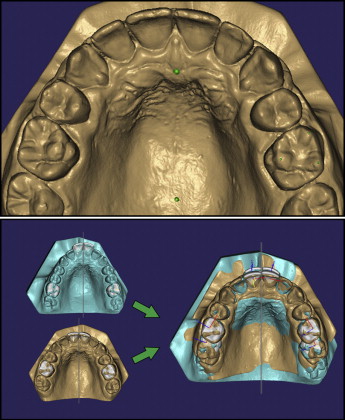
Dental models were scanned using an Ortho Insight 3D laser scanner (version 5.1; Motionview, Hixson, Tenn) with scanning resolution set at 20 μ. The scan data of the pretreatment and posttreatment models were exported from the laser scanner in STL format file extension. These files were imported into the OrthoMechanics Sequential Analyzer (OMSA) (US provisional patent application 61/771,328). Pretreatment and posttreatment digital models were superimposed with the OMSA software by registering 2 points on the digital maxillary model; the first point was located at the distal end of the incisive papilla, and the second point was located distal to the first point along the midpalatal raphe. The software was programmed to automatically draw a 3D reference plane on the palatal area for the best-fit superimposition of the digital models ( Fig 1 ).
A spiral CT machine (model X, vision; GE Medical Systems, Milwaukee, Wis) was used to obtain the pretreatment and posttreatment scans immediately after the hyrax appliance was removed. The CT scans were made at 120 kV and 20 mA, with a scanning time of 2 seconds per section. Scan parameters included an A2-90 scanning filter, a 25-cm field of view, and a 0.4-mm voxel size. These DICOM files were imported into the InvivoDental 3D software (version 5.1; Anatomage, San Jose, Calif). After landmark identification, 14 measurements (6 linear, 8 angular) were recorded from both the CT data and the digital models ( Table I ). All parameters were measured on both the digital models using the OMSA and the CT images using InvivoDental 3D.
| Parameter | Definition |
|---|---|
| R1 torque (°) | Change in maxillary right central incisor labiolingual inclination |
| R1 tip (°) | Change in maxillary right central incisor mesiodistal angulation |
| L1 torque (°) | Change in maxillary left central incisor labiolingual inclination |
| L1 tip (°) | Change in maxillary left central incisor mesiodistal angulation |
| R6 torque (°) | Change in maxillary right first permanent molar buccolingual inclination |
| R6 tip (°) | Change in maxillary right first permanent molar mesiodistal angulation |
| L6 torque (°) | Change in maxillary left first permanent molar buccolingual inclination |
| L6 tip (°) | Change in maxillary left first permanent molar mesiodistal angulation |
| R6 translation (mm) | Distance from the maxillary right first permanent molar furcation point to the midpalatal raphe |
| L6 translation (mm) | Distance from the maxillary left first permanent molar furcation point to the midpalatal raphe |
| Intercanine width (mm) | Distance between the maxillary right and left canines cusp tips |
| Intermolar width (mm) | Distance between tips of the mesiobuccal cusps of maxillary right and left first permanent molars |
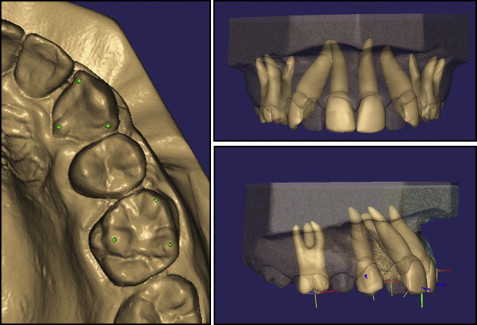
For the software to simulate root position, the outlines of the maxillary central incisor, canine, and first molar crowns were defined and outlined by positioning 3 dots on each tooth crown, and then an avatar (a simulated or virtual tooth and root) was automatically created for the tooth of interest ( Fig 2 ).
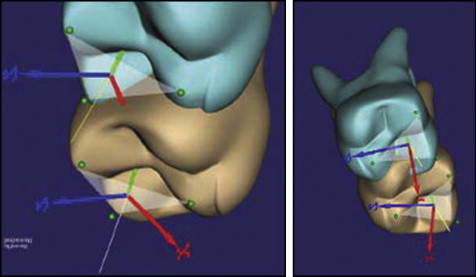
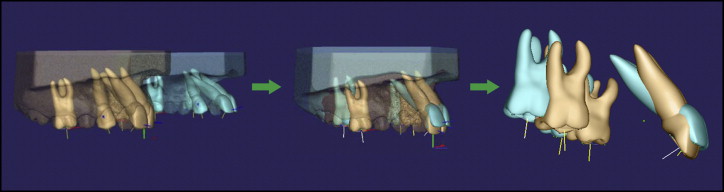
The software was programmed to define a coordinate system related to these teeth guided by the points placed by the operator (S.T.), as explained in the previous step. The software measures the relationship between the tooth coordinates in its pretreatment and posttreatment positions. The coordinate system is composed of the 3 axes of rotation around which a body can rotate in space. The angle difference between the labiolingual and buccolingual axes of the pretreatment and posttreatment avatars is used to describe the change in torque during treatment. The difference in tooth tipping can be described from the angle between the mesiodistal axes before and after treatment. The measured linear and angular changes were recorded in Excel (Microsoft Office; Microsoft, Redmond, Wash) for comparisons with similar measurements taken from the CT images using the Invivo software ( Figs 3 and 4 ).
Measurements on the digital models and the CT images were repeated under the same conditions with a time interval of 1 week. All measurements were made by the same examiner (S.T.). Reliability was estimated as the extent to which the measurements on the digital models and the CT images were repeatable under the same conditions. Validity was considered as the extent to which the measurements on the digital models and the CT images yielded equal results.
Statistical analysis
Statistical analysis was carried out using SPSS software (version 12.0.1; SPSS, Chicago, Ill). Intraobserver reliability was assessed by calculating intraclass correlation coefficients (ICC). Agreement between the digital models and the CT measurements was evaluated using ICC, paired t tests, and Bland-Altman plots. A P value of ≤0.05 was considered statistically significant.
Stay updated, free dental videos. Join our Telegram channel
VIDEdental - Online dental courses


