Introduction
Primary stability is essential to the success of orthodontic mini-implants (OMIs) and heavily depends on the mechanical retention between OMIs and their supporting bone. Alveolar cortical bone commonly serves as the supporting bone for OMIs during treatment. The purposes of this study were to characterize alveolar cortical bone thickness and density in the maxilla and to explore patient factors that may significantly affect these bone properties.
Methods
Sixty medical computed tomography scans of the maxilla were analyzed from a selected sample of patients seen at the Radiology Department of Boston Children’s Hospital. Interradicular alveolar bone thickness and density were measured at 2, 4, 6, and 8 mm from the buccal and palatal alveolar bone crests using the Synapse 3D software (version 4.1; FUJIFILM Medical Systems USA, Stamford, Conn). Analyses were conducted with STATA /1C (version 12.0 for Windows; StataCorp, College Station, Tex) using multivariate mixed-effects regression models and paired t tests.
Results
Mean age and body mass index of the study sample were 17.88 years and 22.94 kg/m 2 , respectively. Cortical bone density and thickness significantly increased from the coronal (2 mm) to the apical (8 mm) regions of the alveolar bone ( P <0.05). At 8 mm from the alveolar crest, interradicular buccal cortical bone was thickest (1 mm) and densest (1395 Hounsfield units) between the first and second molars. On the palatal side, the thickest bone (1.15 mm) was found between the canine and first premolar; it was similarly densest (1406 Hounsfield units) between the first premolar and canine, and between the first premolar and second premolar interradicular bones. On average, palatal cortical bone was thicker and denser compared with buccal; this difference was statistically significant ( P <0.01) in the anterior and middle maxilla, with the anterior maxillary region showing the greatest difference. Female subjects have significantly denser bone compared with male subjects; however, sex is not significantly associated with bone thickness. Body mass index and age are positively associated with bone thickness and density. Radiologic absence of bone was more commonly seen in the anterior maxilla.
Conclusions
Alveolar bone properties vary in the maxilla in patterns that could guide clinicians in selecting sites best suited for placement of OMIs.
Highlights
- •
We quantified maxillary alveolar cortical bone properties using medical CT.
- •
Bone density and thickness increased apically away from the alveolar crest.
- •
On average, palatal cortical bone is denser and thicker than buccal bone.
- •
Patient factors are significantly associated with bone properties.
- •
Patterns exist in the distribution of alveolar bone properties in the maxilla.
Absolute anchorage is often a desired goal during orthodontic treatment; this can be difficult to achieve, since most anchorage biomechanics are tooth-supported, leading to unwanted side effects such as translation or tipping of anchoring teeth. In recent years, orthodontic mini-implants (OMIs) have provided a solution to the problem of unpredictable anchorage because they are bone-supported. A 2008 survey reported that approximately 80% of orthodontists use OMIs, and 78% of them believe that OMIs improve treatment outcomes. Common sites for placement of OMIs are the maxillary and mandibular buccal alveolar bones, infrazygomatic crest, palatal alveolar bone, and paramedian palate. A major limitation of OMIs is loosening (mobility) and subsequent failure, which could lead to premature removal and longer treatment times. Failure rates of OMIs under orthodontic loading have been reported to range from 11% to 30%, whereas success rates of 76% to 87% have also been reported. Possible risk factors that affect the stability of OMIs are supporting bone quality and quantity, screw design, force loads, and safe placement techniques. Some controversy exists over the significance of some of these risk factors with regard to what is optimal; however, it is generally accepted that increased thickness of cortical bone is favorable for OMI stability. Iijima et al in 2012 showed that cortical bone thickness, total bone mineral density, cortical bone mineral density, and bone hardness were significantly related to the mean failure force of OMIs.
Studies that look to characterize cortical bone thickness and density in the alveolar bone have the limitation of small sample sizes, in-vitro studies on skulls, or failing to explore patient factors such as age and sex on cortical bone properties. In addition, cone-beam computerized tomography (CBCT) has several limitations compared with standard medical computerized tomography (MCT) for bone evaluation; Hounsfield units that measure density are not accurate, and increased scatter radiation and artifacts caused by beam hardening are all associated with CBCT.
In this study, we used MCT to quantitatively characterize cortical bone thickness and density in the maxillary alveolar bone and to investigate the influence of patient factors to determine optimal locations for placement of OMIs during orthodontic treatment.
Materials and methods
The study sample consisted of 60 high-resolution MCT scans of the maxillofacial region taken from a pool of patients who had been seen in the Radiology Department of Boston Children’s Hospital for reasons unrelated to this study such as chronic sinusitis and presence of a foreign body in the sinuses (30 female, 30 male). Sample inclusion criteria included patients aged 12 years or older with permanent dentition and a diagnosis of “normal” or “unremarkable” in the radiologist’s report of the MCT scan. Exclusion criteria included significant radiographic signs of periodontal disease, moderate to severe overlapping of crowns or roots of adjacent teeth, trauma to the maxillofacial region, multiple missing teeth, and a positive history of systemic conditions, pathologies, or therapy that may significantly affect cortical bone properties.
Scans were captured using a GE LightSpeed Pro 32 Slice CT unit (GE Healthcare, Little Chalfont, United Kingdom) at 120 KVp, 50 mA, 0.6-mm slice thickness, and mean spatial resolution of 0.63 mm. The images were analyzed using the dental multiplanar reconstruction interphase in the Synapse 3D software (version 4.1; FUJIFILM Medical Systems USA, Stamford, Conn). All reconstructions were done at 0.6 mm with a high spatial frequency bone algorithm. A reference plane parallel to the maxillary occlusal plane was established to generate a 2-dimensional panoramic image of the maxilla and to aid in generating 2-dimensional cross-sectional images. Two-dimensional cross-sectional images of the maxilla were reconstructed at 1-mm intervals (150 cross-sections per scan) and viewed under settings appropriate for bone details (window width, 2000; window level, 400) and sharpened to best delineate cortical boundaries. Best cross-sectional slices through each contact area that clearly delineated interradicular bone without root anatomy were selected for measurements, beginning distally to the right second molar and ending distally to the left second molar.
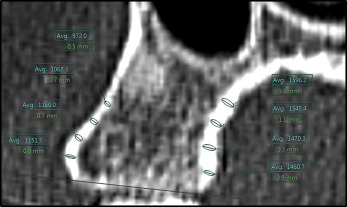
Thickness measurements were made perpendicular to the bone surface using the function “ruler,” and average density measurements were made using the corresponding oval density tool, both in the Synapse 3D software. The demarcation between cancellous and cortical bone was drawn manually by visual gray-white discrimination; gray was perceived as cancellous bone, and white was perceived as cortical bone. Palatal and buccal alveolar cortical bone thickness and density were documented in millimeters and Hounsfield units, respectively. These were measured at 2, 4, 6, and 8 mm from the alveolar bone crest along the surface of the cortical bone ( Fig 1 ). Thus, a maximum of 120 alveolar thickness and 120 mean alveolar density measurements were documented per MCT scan. For additional analysis, measurements were further grouped into anterior maxilla (interradicular bone from the mesial aspect of the canine to the mesial aspect of the contralateral canine), middle maxilla (interradicular bone between the distal aspect of the canines to the mesial aspect of the first molars), and posterior maxilla (interradicular bone between the distal aspect of the first molars to the mesial aspect of the third molars). Training support for image analysis was provided by the Radiology Advanced Image Analysis Laboratory at Boston Children’s Hospital. All measurements were performed by a primary rater (H.O.) and entered into an Excel 2010 spreadsheet version 14.0; (Microsoft, Redmond, Wash). Two hundred randomly selected measurements were repeated, 1 month later, by both the primary rater and a second calibrated rater (A.S.) to assess for intrarater and interrater reliabilities. Both raters were required to recreate new 2-dimensional cross-sectional images using the technique described earlier during reliability measurements. Protocol approval for the study was received from the Committee on Clinical Investigation at Boston Children’s Hospital, and the Committee on Human Studies at Harvard Medical School and Harvard School of Dental Medicine.
Statistical analysis
Descriptive analyses of patient demographics were summarized using means and standard deviations for continuous variables and frequencies with corresponding proportions for the categorical variables. The intraclass correlation coefficient was used to determine both interrater and intrarater reliabilities. Bland-Altman plots were also used to assess agreement between the raters’ measurements. The 2-sample paired t test was used to determine differences in thickness and density between palatal vs buccal cortical bone; because of the expected correlation of intrapatient measurements, the patient was used as the unit of analysis by averaging the total buccal and palatal measurement values for each patient. Multivariate mixed-effects regression models (patient identity was included as a random effect to account for within-patient correlation) were used to explore the effects of alveolar bone height and multiple patient factors such as sex, age, body mass index (BMI), and ethnicity on alveolar bone thickness and density. To test for multiple comparisons on the effect of alveolar bone height on both thickness and density, we used the Bonferroni method for multiple comparisons to adjust for type 1 error inflation. For the regression models, the BMI and age variables were divided into 3 ordinal groups, less than 21 Kg/m 2 , 21 to 25 Kg/m 2 , and greater than 25 Kg/m 2 ; and 12 to 16 years, more than 16 but less than 20 years, and 20 years or more, respectively. All tests were conducted at the significance level of α = 0.05 as is standard, and all statistical analysis were performed using STATA /1C software (version 12.0 for Windows; StataCorp, College Station, Tex).
Results
The mean age of our study sample was 17.88 years (SD, 4.71 years), and the mean BMI was 22.94 kg/m 2 (SD, 4.13 kg/m 2 ). Table I shows the frequency and percentage distributions of the study population by age, sex, BMI, and ethnicity. Approximately half (48%) of the study sample self-identified as white, 32% self-identified as black, and the rest identified as Hispanic (5%), Asian (5%), or American Indian (2%), or chose not to self-identify (8%). Intrarater reliabilities (absolute agreement) within the primary rater were r = 0.98 for density and r = 0.90 for thickness; this is near perfect agreement. Interrater reliability (absolute agreement) comparing the primary rater with the secondary rater was substantial for density ( r = 0.78) and moderate for thickness ( r = 0.60) measurements. Bland-Altman plots ( Figs 2 and 3 ) exploring the agreement between the primary rater vs the secondary rater for the thickness and density measurements showed no evidence of a difference in variability between the raters ( P value for Pitman’s test of difference in variability in both plots were >0.05); the limits of agreement were −0.512 to 0.599 (mean difference, 0.043) for thickness measurements and −299.250 to 310.336 (mean difference, 5.543) for density measurements.
| Male (%) | Female (%) | Total (%) | |
|---|---|---|---|
| Age group (y) | |||
| 12-16 | 8 (13.3) | 12 (20) | 20 (33.3) |
| <16-<20 | 17 (28.3) | 13 (21.7) | 30 (50) |
| ≥20 | 5 (8.3) | 5 (8.3) | 10 (16.7) |
| BMI group | |||
| <21 | 14 (23.3) | 5 (8.3) | 19 (31.7) |
| 21-25 | 8 (13.3) | 13 (21.67) | 21 (35) |
| >25 | 8 (13.3) | 8 (13.3) | 16 (26.7) |
| NA | – | 4 (6.7) | 4 (6.7) |
| Ethnicity | |||
| White | 11 (18.3) | 18 (30) | 29 (48.3) |
| Black | 9 (15) | 10 (16.7) | 19 (31.7) |
| Hispanic | 3 (5) | – | 3 (5) |
| Asian | 3 (5) | – | 3 (5) |
| American Indian | – | 1 (1.7) | 1 (1.7) |
| NA | 4 (6.7) | 1 (1.7) | 5 (8.3) |
The results of the paired t test showed that, on average, palatal bone was thicker and denser than buccal bone; this difference was statistically significant (<0.01) at the anterior and middle regions of the maxilla but not at the posterior maxilla ( Tables II and III ).
| P Mean (SD) |
B Mean (SD) |
P − B Diff (SD) |
Degrees of freedom | t test value | P value | |
|---|---|---|---|---|---|---|
| Anterior maxilla | 0.90 (0.18) | 0.71 (0.11) | 0.19 (0.14) | 56 | 10.50 | <0.001 |
| Middle maxilla | 0.96 (0.18) | 0.78 (0.16) | 0.18 (0.16) | 59 | 8.50 | <0.001 |
| Posterior maxilla | 0.78 (0.14) | 0.76 (0.14) | 0.02 (0.13) | 59 | 1.52 | 0.134 |
| P Mean (SD) |
B Mean (SD) |
P − B Diff (SD) |
Degrees of freedom | t test value | P value | |
|---|---|---|---|---|---|---|
| Anterior maxilla | 1288 (117) | 1227 (121) | 61 (118) | 56 | 3.88 | <0.001 |
| Middle maxilla | 1340 (104) | 1291 (138) | 49 (110) | 59 | 3.43 | 0.001 |
| Posterior maxilla | 1252 (145) | 1224 (174) | 28 (130) | 59 | 1.69 | 0.096 |
Multivariate mixed-effects models controlling for patient identity, alveolar height, sex, ethnicity, BMI group, and age group were used to explore the effect of multiple patient factors on alveolar bone properties simultaneously ( Table IV ). On average, alveolar bone thickness and density increased significantly the farther we measured from the alveolar crest, with regions 8 mm from the alveolar crest having the greatest thickness and density. At 8 mm from the alveolar crest, buccal interradicular bone is thickest and densest between the second molar and first molar, followed by between the first molar and second premolar; it is least thick between the lateral incisor and central incisor, and least dense between the central incisors ( Figs 4 and 5 ). With regard to the palatal aspect at 8 mm, the bone is thickest between the first premolar and canine, followed by between the premolars; it is similarly densest between the first premolar and canine, and between the premolars. It is least thick between the second molar and third molar, and least dense between the central incisors ( Figs 4 and 5 ). Cortical bone could not be delineated at all the 8-mm measurement points. On the buccal side, the interradicular regions with the highest incidence of this occurrence compared with other buccal sites were located between the central incisors (56%), between the first and second premolars (12%), and between the lateral and central incisors (10%). A similar pattern was seen on the palatal side, with the highest incidences compared with other palatal sites seen between the central incisors (89%) and between the lateral and central incisors (6%).
| Coef | SE | Sig | 95% CI | |
|---|---|---|---|---|
| Thickness | ||||
| Alveolar height: 2 mm | ||||
| 4 mm | 0.11 | 0.01 | <0.01 | 0.09, 0.12 |
| 6 mm | 0.21 | 0.01 | <0.01 | 0.19, 0.22 |
| 8 mm | 0.26 | 0.01 | <0.01 | 0.24, 0.28 |
| Sex: male | ||||
| Female | 0.00 | 0.01 | 0.84 | −0.02, 0.02 |
| Ethnicity: white | ||||
| Asian | −0.09 | 0.02 | <0.01 | −0.12, −0.05 |
| American Indian | 0.12 | 0.03 | <0.01 | 0.07, 0.18 |
| Black | −0.01 | 0.01 | 0.38 | −0.03, 0.01 |
| Hispanic | 0.05 | 0.02 | 0.02 | 0.01, 0.08 |
| NA | −0.10 | 0.01 | <0.01 | −0.13, −0.07 |
| BMI group: <21 | ||||
| 21-25 | 0.04 | 0.01 | <0.01 | 0.02, 0.05 |
| >25 | 0.09 | 0.01 | <0.01 | 0.07, 0.11 |
| Age group: 12-16 y | ||||
| >16-<20 y | 0.09 | 0.01 | <0.01 | 0.07, 0.11 |
| >20 y | 0.08 | 0.01 | <0.01 | 0.06, 0.11 |
| Density | ||||
| Alveolar height: 2 mm | ||||
| 4 mm | 109.18 | 8.55 | <0.01 | 92.42, 125.94 |
| 6 mm | 179.45 | 8.52 | <0.01 | 162.74, 196.15 |
| 8 mm | 208.37 | 8.56 | <0.01 | 191.58, 225.16 |
| Sex: male | ||||
| Female | 42.22 | 7.23 | <0.01 | 28.04, 56.40 |
| Ethnicity: white | ||||
| Asian | −94.93 | 14.25 | <0.01 | −122.87, −66.98 |
| American Indian | 32.16 | 24.11 | 0.18 | −15.09, 79.41 |
| Black | 22.38 | 7.36 | <0.01 | −38.81, −7.95 |
| Hispanic | −24.64 | 15.19 | 0.11 | 54.41, 5.14 |
| NA | 34.80 | 11.54 | <0.01 | 12.19, 57.41 |
| BMI group: <21 | ||||
| 21-25 | 39.78 | 7.60 | <0.01 | 24.88, 54.68 |
| >25 | 87.88 | 8.60 | <0.01 | 71.00, 104.75 |
| Age group: 12-16 y | ||||
| <16-<20 y | 124.11 | 7.13 | <0.01 | 110.14, 138.09 |
| ≤20 y | 174.23 | 10.05 | <0.01 | 154.53, 193.93 |
Stay updated, free dental videos. Join our Telegram channel
VIDEdental - Online dental courses


