Disparities remain among the United States population with regard to who receives dental treatment. This article assesses current programs designed to provide dental insurance coverage. This assessment examines person-level use and expenditures as a function of preferences, price, and the use of third-party coverage.
It is 1:15 in the afternoon, and Rep. Elijah E. Cummings has just challenged approximately 200 dental, dental hygiene, and dental postgraduate members of the class of 2008 to not forget those who have been left behind. He made this challenge as he reminds the class of 2008 of the consequences of dental neglect and relates the story of an unfortunate young man in Maryland who recently died as a result of a dental-related brain abscess. With a visceral and emotional oration, Rep. Cummings told the group “Dentist after dentist after dentist refused to treat him.”
Across town just about 1 month later, a forum of advocates, public health experts, researchers, and clinicians gathered and spent a day together reflecting on the development of a comprehensive oral health policy. Topics included:
-
Achieving access and quality in dental care
-
Increasing the dental workforce and program participation of dental providers
-
Education to improve access to dental services
Three months earlier, approximately 100 dental students gathered and attended a practice management seminar, a seminar with the intended goal of teaching dentists how to market and optimize their dental practice. Midway through the seminar, the speaker told the audience that insurance is the disdain of dental practice, and most of his clients do not accept dental insurance. He continued and suggested that each and every member of the audience should also consider not accepting insurance and supported the argument with the view that dentists are well trained, work hard, deserve to be well-compensated, and therefore should be unencumbered with the nuisances of dental insurance. Just a few words in an otherwise well-presented seminar tell much. Although most of the presentation focused on preparing dental students to set up an efficient well-run practice to best serve the community, the feelings expressed about third-party coverage are telling of an adversarial relationship that has fomented over the years; an adversarial relationship between practitioners and the purveyors of dental care coverage both private and public alike.
Just a few years ago, Alaska native tribal health organizations responding to a paucity of dentists in rural areas developed a new solution to address the oral health needs of Alaska natives. The Dental Health Aide Therapist Initiative was designed to educate dental health aide therapists to provide dental care to Alaska natives in rural areas. The focus of the program is on prevention, pain and infection relief, and basic restorative services. Several years later, the American Dental Association reported to its members that a licensing subcommittee of the Minnesota House of Representatives, also responding to a perceived paucity of dentist practitioners, approved the Advanced Dental Hygiene Practitioner workforce model. If enacted, this legislation would allow midlevel providers to perform surgical procedures including extractions and restorations without the supervision of a dentist.
The problem of dental access, especially the availability and participation of dentists to provide care to disadvantaged children, is and has been for the last 20 years a hot topic of concern among elected officials, oral health advocates, and dental professionals. No longer just an issue of local concern, the Domestic Policy Subcommittee of the House Committee on Oversight and Government Reform recently held an oversight hearing on Reforms to Pediatric Dental Care in Medicaid. Concurrently, the Government Accountability Office (GAO) released a report showing that dental disease in children has not decreased. Just a few months earlier, the Agency for Healthcare Research and Quality (AHRQ) released a report on Dental Use, Expenses, Dental Coverage, and Changes, 1996 and 2004 showing that the percentage of children who had public dental coverage increased from 1996 to 2004. Additionally, children with public dental coverage had an increase in the likelihood of having a dental visit from 1996 to 2004.
Previously, Bailit and Beazoglou presented a thorough review and perspective on current trends in public and private expenditures for dental services. They summarized their discourse in part with an optimistic view of the future for middle and upper income families that have the resources to purchase dental services. On the other hand, they follow that although overall use is likely to increase for the foreseeable future, the wide disparities in access to dental care may persist, with low income populations continuing to have major problems accessing dental care.
The purpose of this article is to begin where Bailit and Beazoglou finish and continue the assessment and provide a framework with which to possibly suggest improvements in the design of current programs. Whereas Bailit and Beazoglou examine and discuss person-level use and expenditures as a function of aggregate factors including the role of employer-sponsored dental coverage, federal and state financing, and workforce considerations, this assessment will examine person-level use and expenditures as a function of preferences, price, and the use of third-party coverage.
Dental care services use
Several factors have been associated with the likelihood of having a dental visit. Age, income, race, sex, education, and dental insurance have been shown to be primary determinants of dental use. Other factors, including geographic location, employment status, marital status, and family composition also have been associated with dental use rates.
Analyses of data from different survey sources historically have resulted in national estimates that vary. Sources of data often used to depict national dental use rates include the National Health Interview Survey (NHIS), the National Health and Nutrition Examination Survey (NHANES), and the Medical Expenditure Panel Survey (MEPS). Variations among survey results may be attributable in part to differences in survey design, question format, survey procedures, and length of time asked of respondent to recall. Fortunately, sociodemographic and economic trends appear to be generally consistent across surveys. Each survey has its merits, and choice of survey should be made according to the primary question of interest. For the purpose of this manuscript, I will follow the lead of the US Department of Health and Human Services, which uses MEPS for the following Healthy People 2010 oral health access benchmarks:
-
21-10. Increase the proportion of children and adults who use the oral health care system each year
-
21-12. Increase the proportion of low-income children and adolescents who received any preventive dental service during the past year
MEPS is sponsored by the AHRQ and is a survey of families and individuals, their medical providers, and employers across the United States. MEPS is the most complete source of data on the cost and use of health care and health insurance coverage. Of the three surveys, MEPS also may be the least susceptible to variation resulting from survey design.
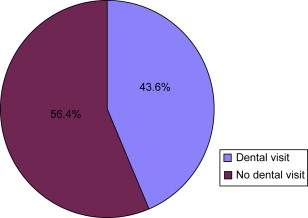
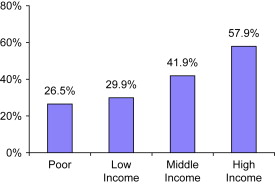
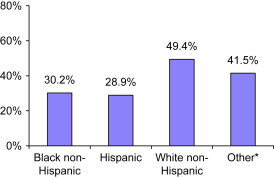
Recent data available from the MEPS show that 44% ( Fig. 1 ) of the community population had a dental visit during 2004. Generally, use rates have remained remarkably stable over the last 30 years. On the other hand, data suggest that although the use rate for children and the elderly increased during this same period, the gap between lower- and higher-income people has widened. Indeed, recent data appear to confirm Bailit and Beazoglou’s gloomy outlook for low-income populations. Although 58% ( Fig. 2 ) of people from a high-income family had at least one dental visit during the year, only 30% of people from a family with low income had at least one dental visit. Black non-Hispanic and Hispanic people were less likely ( Fig. 3 ) to have a dental visit in 2004 than white non-Hispanics.
Dental expenditures
Bailit and Beazoglou note that the amount of money spent on dental care is a measure of a population’s use of dental services, and differences in dental expenditures among population subgroups might suggest problems of access within the United States. Data available from the Centers for Medicare & Medicaid Services (CMS) sponsored National Health Expenditure Accounts (NHEA) show that dental care expenditures have been steadily increasing during the past half century. In nominal terms, American spending increased from $1.96 billion in 1960 to $21.65 billion in 1985 to $81.50 billion in 2004. The increase has been steady and dramatic. Even adjusted for inflation, American spending has been remarkable, increasing from $12.51 billion in 1960 to $38.01 billion in 1985 to $81.50 billion in 2004.
For comparison purposes, an expenditure amount adjusted for inflation is provided. Specifically, expenditures are adjusted to 2004 using Bureau of Labor Statistics-derived factors of 6.38 for 1960 and 1.76 of 1985 (adjustments were calculated as follows: the consumer price index is 29.6 for 1960, 107.6 for 1985 and 188.9 for 2006; so the adjustment factors are 188.9/29.6=6.38 for 1960 and 188.9/107.6=1.76 for 1985).
An annual expenditure of $81 billion is not an inconsequential amount, and represents just over 4% of all health expenditures during 2004.
Data available from the MEPS show that the total dental expense for the community population of the United States was $72 billion in 2004.
MEPS expenditure estimates are based on person-level survey data from a nationally representative sample of households in the civilian noninstitutionalized population and are linked directly to patient care events. In contrast, the NHEA estimates are constructed primarily from aggregate provider revenue data and cover a broader population and wider range of services. The NHEA cover the entire United States population, including the institutionalized population, and a full range of health care expenditures, such as public health services and research.
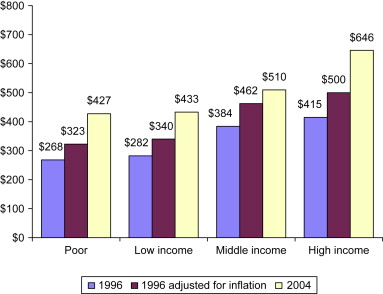
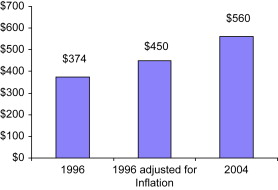
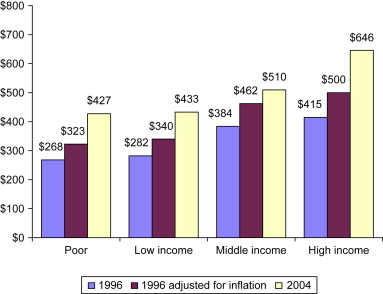
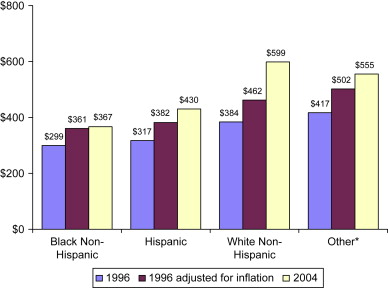
The average dental expense for a person with a dental visit ( Fig. 4 ) increased from $374 ($450 adjusted for inflation) in 1996 to $560 in 2004. For each income category except for middle income, the average expense ( Fig. 5 ) (adjusted for inflation) for a person with a dental visit increased from 1996 to 2004. White non-Hispanics and Hispanics and people of other race/ethnicity categories had a statistically significant increase ( Fig. 6 ) in oral health-related expenses from 1996 to 2004.


Dental expenditures
Bailit and Beazoglou note that the amount of money spent on dental care is a measure of a population’s use of dental services, and differences in dental expenditures among population subgroups might suggest problems of access within the United States. Data available from the Centers for Medicare & Medicaid Services (CMS) sponsored National Health Expenditure Accounts (NHEA) show that dental care expenditures have been steadily increasing during the past half century. In nominal terms, American spending increased from $1.96 billion in 1960 to $21.65 billion in 1985 to $81.50 billion in 2004. The increase has been steady and dramatic. Even adjusted for inflation, American spending has been remarkable, increasing from $12.51 billion in 1960 to $38.01 billion in 1985 to $81.50 billion in 2004.
For comparison purposes, an expenditure amount adjusted for inflation is provided. Specifically, expenditures are adjusted to 2004 using Bureau of Labor Statistics-derived factors of 6.38 for 1960 and 1.76 of 1985 (adjustments were calculated as follows: the consumer price index is 29.6 for 1960, 107.6 for 1985 and 188.9 for 2006; so the adjustment factors are 188.9/29.6=6.38 for 1960 and 188.9/107.6=1.76 for 1985).
An annual expenditure of $81 billion is not an inconsequential amount, and represents just over 4% of all health expenditures during 2004.
Data available from the MEPS show that the total dental expense for the community population of the United States was $72 billion in 2004.
MEPS expenditure estimates are based on person-level survey data from a nationally representative sample of households in the civilian noninstitutionalized population and are linked directly to patient care events. In contrast, the NHEA estimates are constructed primarily from aggregate provider revenue data and cover a broader population and wider range of services. The NHEA cover the entire United States population, including the institutionalized population, and a full range of health care expenditures, such as public health services and research.
The average dental expense for a person with a dental visit ( Fig. 4 ) increased from $374 ($450 adjusted for inflation) in 1996 to $560 in 2004. For each income category except for middle income, the average expense ( Fig. 5 ) (adjusted for inflation) for a person with a dental visit increased from 1996 to 2004. White non-Hispanics and Hispanics and people of other race/ethnicity categories had a statistically significant increase ( Fig. 6 ) in oral health-related expenses from 1996 to 2004.
Paying for dental care
Dental care is expensive, and paying for dental care for many Americans can be difficult. Studies have shown that the cost of dental services matters. Among the reasons given for not going to the dentist, some have reported that dental care was too expensive. On the other hand, people do pay for and receive dental care. Patients are consumers and are willing to pay for services and expect to derive a personal benefit for these payments. Utility is the term usually used to describe measure and compare differing levels of expected benefit. Patients as consumers will allocate funds and select a set of services, or proposed treatment, that will help to maximize their overall utility. Price, or cost, is the market value that will purchase a specific set of services. Dental care demand is the quantity of services or care that a patient is willing to purchase at a specific price. Not all dental services are alike, and the demand for dental care is not monolithic. Some dental services patients want, and some dental services patients do not want but need. For some services, patients are insensitive to variations in price (price inelastic) and for other services patients will exhibit varying degrees of demand depending upon the price (price elastic). For some patients, even if the price of dental care were zero, use rates would vary, because attitudes and other demand factors differ.
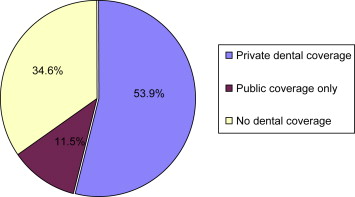
Almost two thirds ( Fig. 7 ) of all Americans receive some assistance in paying for dental care through dental care coverage or dental insurance. During 2004, approximately 54% of the community population had private dental coverage (see Fig. 7 ), and approximately 12% of the community population had public dental coverage only. The increase among Americans with private dental insurance has been steady since 1967, when only 4.5 million persons were covered. By 2004, approximately 158 million people had some form of private dental care coverage. Public coverage for dental care also has increased, especially among children. Corresponding with the advent of the State Child Health Insurance Plan (SCHIP) in 1997, the percentage of children who had public dental coverage increased from 18% in 1996 to 26% in 2004. Dental care benefits lower the out-of-pocket or perceived cost of dental care, thereby stimulating demand. In 2004, 57% ( Fig. 8 ) of the population with private dental coverage had a dental visit; 32% of the population with public dental coverage had a dental visit, and 27% of the population without any dental coverage had a dental visit. Although dental care benefits lower the out-of-pocket cost of dental care, making dental care more affordable, people from lower income families ( Fig. 9 ) were less likely to have private dental coverage in 2004 than people from a family with higher income. Additionally, although Black non-Hispanic and Hispanic persons were more likely to have public dental coverage ( Fig. 10 ), they were less likely to have private dental coverage in 2004 than white non-Hispanics or people of other race/ethnicity categories. Public dental coverage is less effective than private coverage in making dental care more affordable and available. Plan design, large provider networks, efficient administrative services, and market-based fee schedules are just a few of the features that cause private plans to be more effective than public plans in making dental care more affordable and available. The average annual expense ( Fig. 11 ) for a person with a dental visit was $612 for a person with private dental coverage, $326 for a person with public dental coverage only and $482 for a person with no dental coverage during 2004.