35 Prognostic Index for Overall Disease Control in Patients with Parotid Carcinoma
Overview of Prognostic Research
Disease-Specific Survival in Patients
Results of Univariate and Multivariate Survival Analysis
Development of a Prognostic Index for Disease Control
External Validation of the Prognostic Index
Independent Sample for the National and International Validation Study
Clinical Usefulness, User-Friendly Translation
Limitations of the Current Prognostic Index System
Future Developments in Prognostic Research
Introduction
It is extremely difficult to assess the prognosis for patients with salivary gland carcinoma, a disease that is characterized by its low incidence, a variety of grades of differentiation in the tumors, and a heterogeneous histological appearance. Incidence rates for “salivary gland carcinoma” range from four to 65 new patients per 106 population per year, with very high rates being reported in Greenland1 and the Canadian Arctic (135 per 106).2 Salivary gland carcinomas occur in many different sites in the head and neck; this chapter specifically deals with the parotid, the site most frequently involved. The world standard population age-adjusted incidence of parotid carcinoma per 106 person-years in Belgium in the period 2004–2005 was six for men and four for women, accounting for 3.9% of Belgian head and neck cancers.3 In the international literature, 1%–3% of all head and neck carcinomas are typically reported to be parotid carcinomas.4 In general, about 70% of salivary gland carcinomas arise in the parotid.3,5,6
Within this rare disease entity, the 2005 World Health Organization classification distinguishes 24 different types, and even then clinical experience shows that tumors classified within the same tumor type may be associated with quite different clinical outcomes (Table 35.1).7 Histopathological grading attempts to predict variable biological behavior within one histotype. Unfortunately, grading remains controversial due to a lack of standardization and a weak consensus regarding the grading criteria.8 Collinearities between the International Union Against Cancer (UICC) stage and grade,9 age and grade,10,11 and positive resection margins and grade11 often make grading less important in clinical decision-making than factors coincidental with it that are more reliably reproducible. In most centers, grading is carried out for the three most frequent types: mucoepidermoid carcinoma (MEC),8 acinic cell carcinoma (AcCC),12 and adenoid cystic carcinoma (AdCC).9
In our own center, implications for treatment are only drawn from the grading of MEC into low-grade versus intermediate and high-grade types. Patients with low-grade, low-stage, and completely resected MECs do not require any additional radiotherapy.13 Patients who have the aggressive high-grade subset of AcCCs (16.5% of 438 graded tumors out of a total of 1353 AcCCs) should receive postoperative radiotherapy.12,14
Overview of Prognostic Research
Prognostic research in oncology tries to predict specific outcomes by relating them to specific prognostic factors. Most published prognostic research studies are limited to the identification of prognostic factors. The studied outcomes are time–event outcomes, consisting of a time variable (usually the interval between the diagnosis and the date of surgical treatment) and a variable indicating whether the event being studied occurred at that time or not (censoring at last follow-up). This event is death from any cause, for “overall survival.” The event is “tumor recurrence anywhere”—whether local, regional, at a distance, or a combination of these—when one is studying the “recurrence-free interval” or “disease control,” reflecting the result obtainable after the initial treatment. This is the outcome studied in the prognostic index described in this chapter. Other studies dealing with “disease-specific survival” have death due to tumor as the central event and give an idea of the best obtainable treatment result for all possible treatments given. All of these events are called “failure,” as they are the opposite of what treatment is aiming for.
|
1. Acinic cell carcinoma |
|
2. Mucoepidermoid carcinoma |
|
3. Adenoid cystic carcinoma |
|
4. Polymorphous low-grade adenocarcinoma |
|
5. Epithelial–myoepithelial carcinoma |
|
6. Clear cell carcinoma, not otherwise specified |
|
7. Basal cell adenocarcinoma |
|
8. Sebaceous carcinoma |
|
9. Sebaceous lymphadenocarcinoma |
|
10. Cystadenocarcinoma |
|
11. Low-grade cribriform cystadenocarcinoma |
|
12. Mucinous adenocarcinoma |
|
13. Oncocytic carcinoma |
|
14. Salivary duct carcinoma |
|
15. Adenocarcinoma, not otherwise specified |
|
16. Myoepithelial carcinoma |
|
17. Carcinoma ex pleomorphic adenoma |
|
18. Carcinosarcoma |
|
19. Metastasizing pleomorphic adenoma |
|
20. Squamous cell carcinoma |
|
21. Small cell carcinoma |
|
22. Large cell carcinoma |
|
23. Lymphoepithelial carcinoma |
|
24. Sialoblastoma |
Disease-Specific Survival in Patients
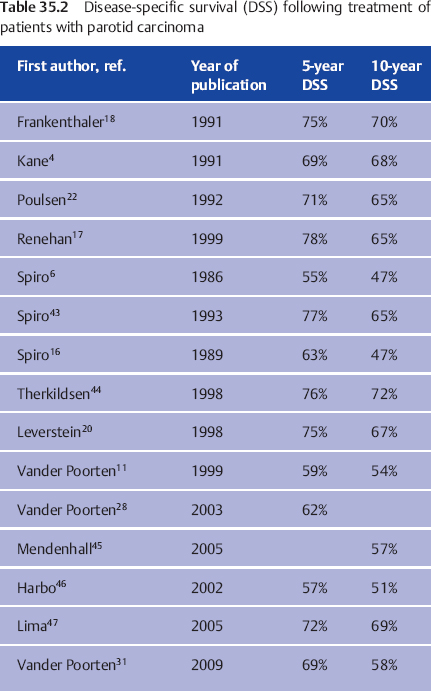
Results of treatment of patients with parotid carcinoma in major treatment centers, known as disease-specific survival (DSS), are shown in Table 35.2. Interpretations of these figures have to take into account the specific context of stage, percentage of high-grade tumors, treatment period, treatment regimens, patient inclusion criteria, and quality of follow-up. Clearly, series with limited follow-up15 will present better results than series describing patients followed for a much longer time.11,16 Another example is the decision to exclude patients receiving palliative treatment from the 1999 Manchester series,17 which resulted in a group with a relatively low stage at presentation (only one in five patients were in stages III–IV) and a DSS in the high range of the results shown in Table 35.2. This contrasts with the 1999 Amsterdam series, in which the inclusion of patients receiving palliative treatment increased the proportion of advanced-stage disease (one in four patients had stage IV disease), explaining the lower DSS.
The group DSS figures in Table 35.2 are too general to be used in counseling a specific patient. To be able to tailor the prognostic estimate to the individual patient, doctors have to identify prognostic factors that are present or absent in a patient with a new diagnosis of parotid carcinoma, which together may imply a better or poorer expected outcome than the group prognosis in Table 35.2. If doctors are aware of these factors and of the relative importance of additional factors that are present in a given patient, they are able to individualize the prognostic estimate.
 The prognostic factors studied in patients with salivary gland carcinomas consist of patient-related and tumor-related clinical and pathological factors; more recently, they have also included increasing numbers of molecular-biological factors.51,52
Results of Univariate and Multivariate Survival Analysis
The biostatistical tools most frequently used to explore the relationship between prognostic factors and oncological outcomes are univariate survival analysis, using the Kaplan–Meier method,18 and multivariate survival analysis using Cox proportional hazard analysis.19 Prognostic factors for parotid carcinoma have been identified and confirmed with univariate and multivariate analysis; the latter is preferable, as it makes it possible to adjust the impact of a prognostic factor for the effect of other prognostic factors.4,11,15–18,20–23 Histological type24 and grade,4,16,18,21,23,25 stage,4,11,15–18,20,21,23,24,26 age,4,11,16,23,25–27 gender,4,21,23 pain,4,11 skin and soft tissue invasion,11,17,21,23 facial nerve involvement and perineural growth,11,18,21,23,26 treatment (resection margins),11,15,23,25 and comorbidity28 have emerged as important prognostic factors for this disease.
Interpretation of P Values
The typical way of presenting this information is to list the investigated prognostic factors tablewise together with their respective importance as reflected in the accompanying P values. To obtain a prognostic estimate for a patient, the clinician is expected to make an intuitive amalgam of these factors. Most studies stop at the level of identification/confirmation and, if hazard ratios are reported, at the level of quantification. At this level, most studies leave the clinician helpless, without a clear indication of how to apply this knowledge in clinical reality. The fact that some factors are retained in one study and rejected in another is confusing, to say the least. In addition, different reports investigate varying groups of diseases (parotid versus parotid and submandibular versus all salivary gland carcinomas) in relation to different outcomes. The result is that most clinicians do not use the information resulting from these studies of prognostic factors at all.
 Most studies only give prognostic factors, P values, or hazard ratios, leaving the clinician helpless. Often, no clear information is given on how to apply the results in clinical routine work.
The interest in the P value accompanying a certain factor, suggesting that a smaller P value corresponds to a more important factor, is not really justified, as these P values depend on the number and definition of the factors studied, the number of patients studied, and the sequence in which the variables are entered in the Cox model. More important is the mutual effect that specific variables have when a multivariate model is being developed, but this information is usually not reported.
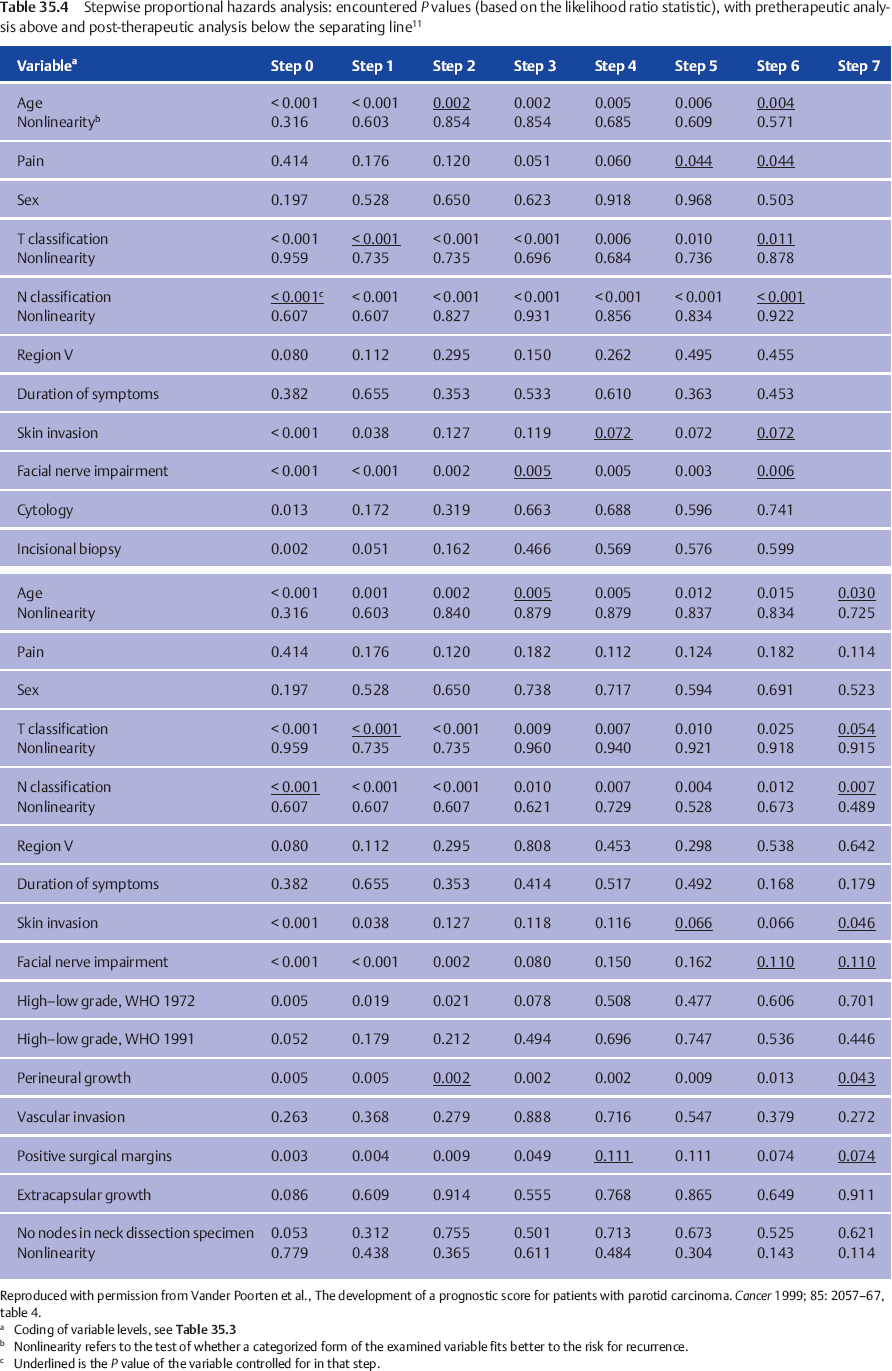
In our own multivariate analysis,11 we therefore presented the exact sequence in which all the variables were entered, precisely defining the variables and their scale definition (cf. Table 35.3), so that the reader can appreciate the P values at each step and the way in which they change after the next variable has been entered into the model (cf. Table 35.4). The observed changes result from the fact that different factors refer to the same aspect of the risk for treatment failure, thus explaining why a prognostic variable (e.g., the clinical grade of malignancy) is important in one study, but fails to remain important in the final multivariate model in another study in which the final model includes other strongly associated variables (in the case of grade, for example, TNM classification, age, nonradical resection)—simply meaning that the levels of these factors divide the patient group into comparable prognostic groups.
|
Variable |
Coding and levels eventually used |
|
Age (y) |
Lineara and categorized (< 40, 40–70, > 70) |
|
Pain |
Dichotomy (pain or facial numbness on presentation: yes vs. no, or not reported in the record) |
|
Sex |
Male versus female |
|
T classification (UICC 1992) |
Linear and categorized: T1–T4 (< 2 cm, 2–< 4 cm, 4–< 6 cm, > 6 cm) |
|
N classification (UICC 1992) |
Linear (N0, N1, N2a, N2b, N2c, N3) and categorized (N0, N1, > N1), N2a–N3 grouped together on the basis of small numbers |
|
Neck region V |
Dichotomy: furthest lymph node in region V versus furthest lymph node in regions I–IV |
|
Reported duration (weeks) |
Categorized (< 3, 3–6, 6–12, 12–24, > 24) |
|
Skin invasion |
Yes versus no |
|
Facial nerve impairment |
Yes versus no |
|
Cytology |
Level 1 = not suspect, level 2 = acinic cell, level 3 = other malignant types |
|
Incision biopsy complemented with cytology |
Level 1 = not suspect, level 2 = acinic cell, level 3 = other malignant types (For patients without incision biopsy data, cytology data were used) |
|
High–low grade (1972) |
WHO classification 1972: Dichotomy in this classification based on Million et al.48: “high grade” (high-grade mucoepidermoid carcinoma, adenocarcinoma, undifferentiated carcinoma, squamous cell carcinoma, malignant mixed tumor, adenoid cystic carcinoma) versus “low-grade malignant” group (acinic cell carcinoma, low-grade mucoepidermoid carcinoma) as the reference category. Spiro16,49 uses the same reference level (low-grade mucoepidermoid and acinic cell) |
|
High–low grade (1991) |
WHO classification 1991:d Dichotomy: “high-grade malignant” (high-grade mucoepidermoid carcinoma, adenoid cystic carcinoma, salivary duct carcinoma, adenocarcinoma NOS, carcinoma ex pleomorphic adenoma, small cell carcinoma, squamous cell carcinoma and undifferentiated carcinoma) versus “non–high-grade,” consisting of lesions generally considered as low-grade: acinic cell carcinoma, polymorphous low-grade adenocarcinoma, epithelial–myoepithelial carcinoma and basal cell adenocarcinoma (the latter two with rather uncertain but probably not highly aggressive behavior)50 |
|
Perineural growthb |
Dichotomy: described versus not described in the pathology report |
|
Vascular invasionb |
Dichotomy: described versus not described in the pathology report |
|
Surgical marginsb |
Dichotomy: positive versus “close and negative margins” |
|
Extracapsular growthc |
Dichotomy: extracapsular growth versus no lymph nodes and lymph nodes without extracapsular growth |
|
No. of lymph nodes in neck dissectionc |
Linear and categorized (0 as reference level, 1, 2–5, 6–“lump”) |
|
Treatment modality |
1 = surgery, 2 = surgery followed by radiotherapy, 3 = radiotherapy, 4 = nonstandard therapy |
|
Period of treatment |
Linearly and categorized (four equal patient groups:1973–1977, 1978–1983, 1984–1988, and 1989–1994) |
|
Location of treatment |
1 = treated completely in our hospital, 2 = insufficient surgery elsewhere, reoperated and radiotherapy in our hospital, 3 = sufficient surgery elsewhere, radiotherapy in our hospital |
Reproduced with permission from Vander Poorten et al., The development of a prognostic score for patients with parotid carcinoma. Cancer 1999;85: 2057–67, table 1.
UICC, International Union Against Cancer, WHO: World Health Organization; NOS, not otherwise specified.
b Only evaluated for patients who had surgery.
c Only evaluated for patients who had a neck dissection.
Development of a Prognostic Index for Disease Control
A multivariate analysis of patients at the Netherlands Cancer Institute was carried out in order to define a set of prognostic factors that best explains the observed variability in the outcome “recurrence-free interval” (treatment result obtainable after the initial therapy).11 In a cohort of 151 consecutive patients who received treatment with curative intent between 1973 and 1994, and with a follow-up of 94 months, clinical and pathological factors were evaluated in a multivariate proportional hazard analysis. The patient, tumor, and treatment factors, and the definition of their levels as used in the analysis, are shown in Table 35.3.11 As several of the factors studied were expected to be highly correlated (e.g., a high T level associated with a higher percentage of nonradical resections), a stepwise Cox model was used to identify and quantify important prognostic factors.
We considered two important moments in the clinical pathway of the patient with parotid carcinoma at which the question of prognosis arises. The first prognosis question follows the diagnostic work-up. The second arises when the histopathology report becomes available. For both questions, both before starting treatment and following surgery, a prognostic index allows the clinician to give a “scientific” estimate of the prognosis based on the weighted combined effect of important factors. Table 35.4 shows the different steps used to reach the final multivariate model, the variables considered, and the variation of P values. The factors finally retained and their hazard ratios in the pretreatment and posttreatment setting are shown in Table 35.5.
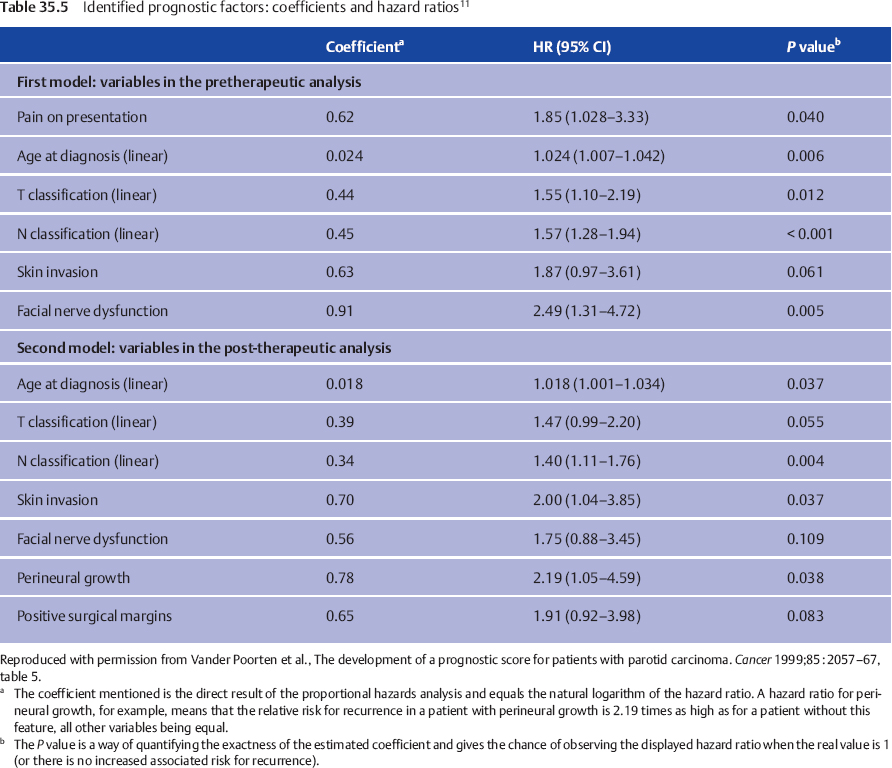
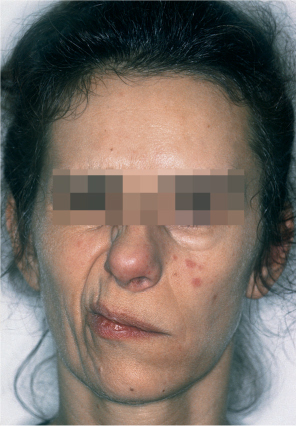
Fig. 35.1 Facial nerve dysfunction as a negative prognostic factor in this patient with parotid carcinoma.
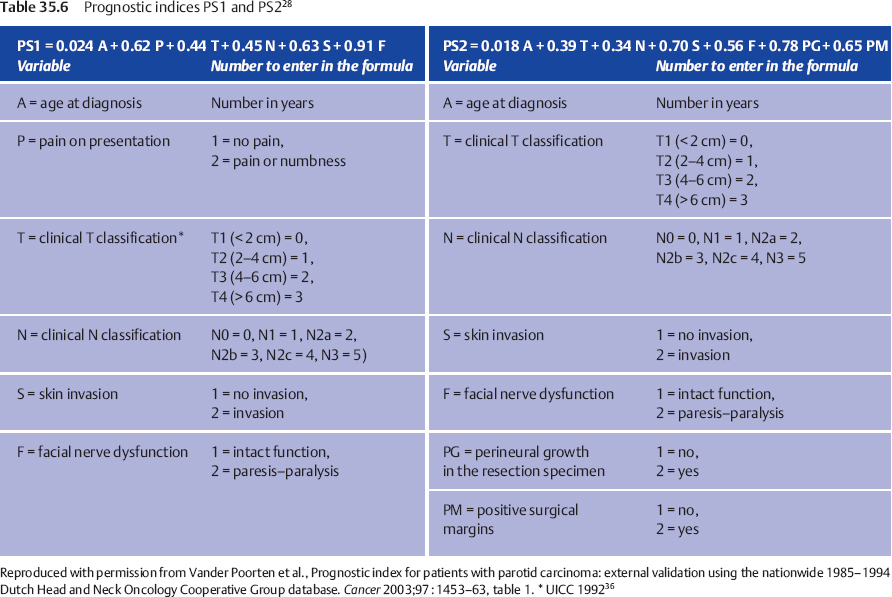
When two patients with the same set of prognostic factors except for the presence of facial nerve dysfunction are compared, the patient with nerve dysfunction has a 2.49 times increased risk for tumor recurrence following treatment in comparison with the one with normal nerve function (Fig. 35.1). This hazard ratio (HR) of 2.49 can be compared, for example, with the HR of 1.87 associated with the factor “skin invasion,” and thus this HR reflects the relative prognostic impact of these factors. For one patient, a prognostic index combines the properly weighted contributions of each important clinical and histological characteristic into one number that corresponds to an individualized risk of tumor recurrence. Prognostic score 1 (PS1) answers the question of prognosis following the diagnostic work-up; PS2 incorporates information from the pathological report and answers the postoperative prognosis question (Table 35.6).
 Prognostic Score 1 (PS1)
PS1 is calculated by multiplying every coefficient (e.g., 0.91) by its corresponding factor (e.g., F = 2 for a patient with facial palsy), and then adding up all the numbers. The combined effect of all six factors in PS1 is visualized by dividing the study population into four groups using the cut-off points PS1 < 3.85 (PS1 = 1), PS1 = 3.85–4.74 (PS1 = 2), PS1 = 4.75–5.80 (PS1 = 3), and PS1 > 5.80 (PS1 = 4), creating four clinically relevant subsets of patients with good, somewhat worse, intermediate, and poor prognoses, with the respective 5-year recurrence-free rates (95% CI) of 92% (73%–98%), 83% (63%–92%), 48% (26%–67%), and 23% (9%–41%).
 Prognostic Score 2 (PS2)
Using PS2 for the postoperative setting, four patient groups were again defined on the basis of PS2 < 3.99 (PS2 = 1), PS2 = 3.99–4.80 (PS2 = 2), PS2 = 4.81–5.67 (PS2 = 3), and PS2 > 5.67 (PS2 = 4), creating corresponding recurrence-free interval curves and 5-year recurrence-free rates (with 95% confidence intervals) of 95% (70%–99%), 83% (60%–93%), 56% (31%–75%) and 42% (22%–61%), respectively.
We can thus assign an actual patient to one of four prognostic groups with an expected recurrence-free percentage based on the combined prognostic effect of features that remained significant in the multivariate analysis, substantiating our clinical impression that a patient’s prognosis is good, intermediate, or poor.
External Validation of the Prognostic Index
When a prognostic discrimination of a population is used to construct the prognostic index the discrimination will most probably be overestimated—a well-known feature known as “overoptimism.”29 This implies an expected decline in the performance of a prognostic index in other populations. To justify prospective use, we have to find out whether the expected decline in the prognostic power is acceptable by applying the prognostic index to an independent patient group. This “external validation” helps establish the real predictive power of the index.29,30
To perform this external validation, a new, independent patient population has to be collected, the index has to be calculated by filling out the different variables in the index, and predictions have to be compared with outcomes. In this way, both clinical validity and statistical validity can be assessed.29 Clinical validity is present when the index predicts accurately enough. This accuracy consists of discrimination (the correct relative ranking of individual risk) and calibration (the predicted recurrence rate is neither too high nor too low).30 The more the accuracy proves to be generalizable (reproducible and transportable), the more likely the index is to be clinically useful. Statistical validity evaluates whether this index is the best one that can be constructed statistically.
 Independent Sample for the National and International Validation Study
The nationwide database of the Dutch Head and Neck Oncology Cooperative Group (Nederlandse Werkgroup HoofdHals Tumouren, NWHHT) includes 231 consecutive patients treated with curative intent for parotid carcinoma at the university hospitals in Groningen, Leiden, Maastricht/Heerlen, Nijmegen, Rotterdam, and Utrecht during the period 1985–1994. The median follow-up was 52 months at the time the validation study was performed.28
For the international validation, we used a database including 239 consecutive patients with parotid carcinoma treated with curative intent from at academic medical centers in Leuven (n = 67) and Brussels (n = 61) in Belgium, and Cologne (n = 101) in Germany, during the period 1983–2004 (mean follow-up 55 months).31
 Assessment of Validity
Clinical Validation
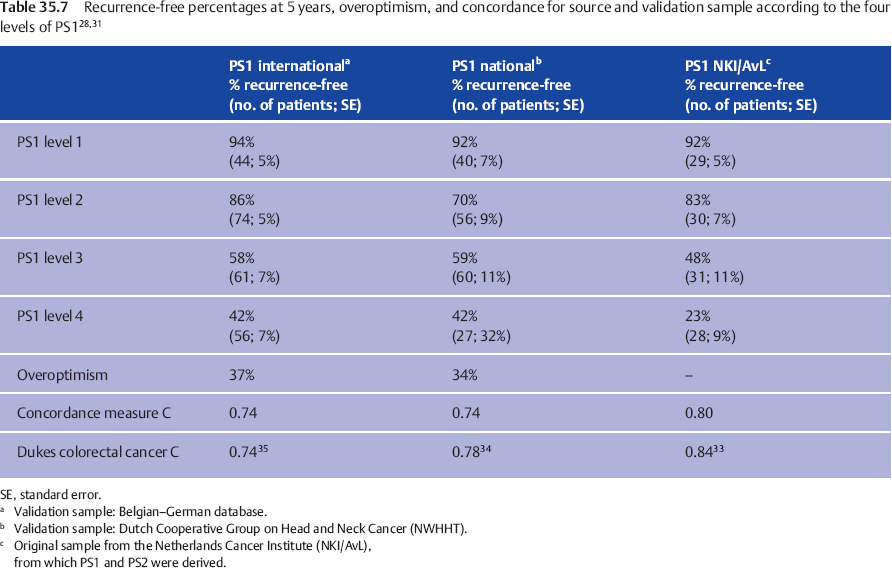
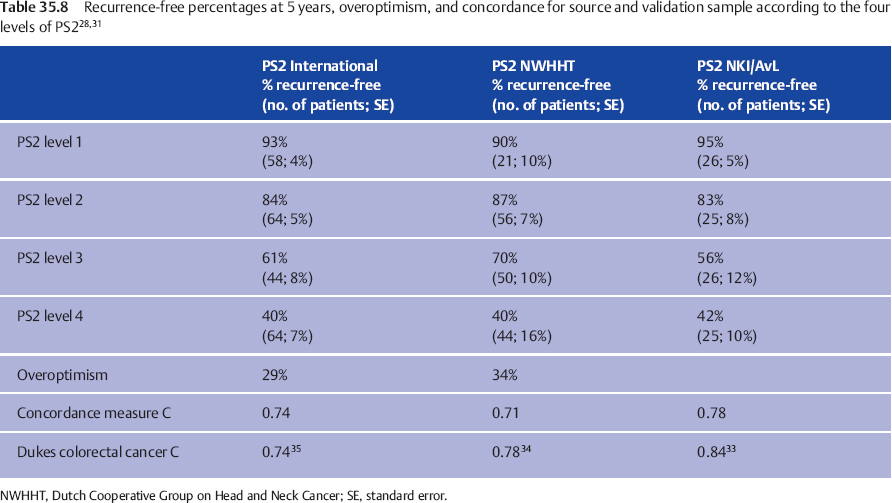
To assess the clinical validation, PS1 and PS2 were examined for predictive power in both validation groups. Discrimination was evaluated by calculating the indices for each patient and drawing Kaplan–Meier recurrence-free interval curves, according to the cut-off points in the source population.11 The 5-year recurrence-free intervals in the national and international samples are compared with those in the source population in Table 35.7 (for the preoperative prognostic estimate, PS1) and Table 35.8 (for the postoperative prognostic estimate, PS2).
The result is good for PS1, while for PS2 discrimination between the two lowest score groups is suboptimal, but good for the groups with PS2 = 3 or 4. Tables 35.7 and 35.8 also show the quantification of the overoptimism in estimating the amount of fit of the indices to both the national and the international datasets, by entering the newly calculated PS into the Cox model. In this way, overoptimism is quantified as 34% for PS1 and 38% for PS2 in the nationwide database (Table 35.7), and as 37% for PS1 and 29% for PS2 in the international database (Table 35.8). These are, statistically, very satisfactory values. The relation between patient ordering and PS and recurrence time was assessed by computing concordance measure C,32 a measure estimating the proportion of all pairs of patients in whom the order of the two prognostic indices concurs with the order of the observed recurrence-free periods. Applying a score to a validation sample typically results in a fall in concordance measure C in comparison with the value in the source population. Table 35.7 shows this fall from 0.80 to 0.74 for PS1 and from 0.78 to 0.71 for PS2 in the Dutch nationwide validation sample, a fall comparable to that observed in external validations of other well-accepted prognostic systems.
The Dukes classification for rectal cancer showed a concordance measure C of 0.84,33 declining to 0.78 in the external validation by Jass et al.34 and to 0.74 in the study by Harrison et al.35 A comparable decline from 0.8534 to 0.80 and 0.79 in the study by Harrison et al.35 is observed for the Jass classification system. Similarly comparable to these observations is the fall in concordance measure C observed in our international validation study from 0.80 to 0.74 for PS1 and from 0.78 to 0.74 for PS2 (Table 35.8). Calibration was evaluated by comparing the observed recurrence-free percentages for the different levels of PS in the national (Table 35.7)28 and international databases (Table 35.8)31 with the reported percentages in the source population, and was found to be adequate, although the four groups in both validation samples have less divergent prognoses, with a relatively broader standard error. This illustrates the expected “overoptimism.”
Statistical Validation
The statistical validation is described in greater detail in our published papers.28,31 The null hypothesis tested here states that the weights for the individual prognostic variables as calculated in the source population, as well as the scale of definition of the variables used, can be retained, and that inclusion of new patient characteristics or tumor characteristics will not improve the predictive power. Using the data in the validation samples, no evidence to reject this null hypothesis was produced. The proportional hazard assumption was also confirmed.
The external validations thus support the finding that the PS indices are transportable and thus generalizable to patients outside the source population.30 Geographic transportability is addressed by recruiting patients from all over the Netherlands in the national validation study and from Belgium and Germany in the international validation study. Transportability in time is addressed by the recruitment of validation samples over a shorter and later time span than the source population. Transportability in methodology is addressed by observing an acceptable performance despite the presence of more missing values in the validation samples. Transportability in follow-up is addressed by the shorter follow-up in the validation samples in comparison with 94 months for the source population. The acceptable loss in concordance measure C, as well as the absence of a changing effect of PS with time, suggest that PS1 and PS2 are relatively robust to differences in follow-up period. On the five-level hierarchy of external validity for predictive systems (Table 35.9), the upper level 5 is reached (multiple independent validations with life-table analyses).30
|
Level of validation |
|
|
0 |
Internal validation |
|
1 |
Prospective validation |
|
2 |
Independent validation |
|
3 |
Multisite validation |
|
4 |
Multiple independent validations |
|
5 |
Multiple independent validations with life-table analyses |
 It has been shown that the prognostic index can be used all over the world for patients with parotid cancer.
< div class='tao-gold-member'>
Stay updated, free dental videos. Join our Telegram channel
VIDEdental - Online dental courses


