Introduction
The aims of this study were to confirm the efficacy of the Bolton index in a group of natural Class I white Italian patients with complete dentition, minimal crowding, and no previous orthodontic treatment, and to evaluate the mesiodistal tooth dimensions with multivariate cluster analysis.
Methods
Tooth measurements were obtained from a sample of 56 patients with normal occlusion, with a normal Bolton index (22 men, 34 women; mean age, 27.8 years), without previous orthodontic treatment or prosthetic or Class II restorations. Maxillary and mandibular measurements were analyzed separately in the sexes. Clustering was performed using the partitioning around medoid algorithm and principal component analysis-based transformed data. Statistical analysis was conducted.
Results
The multivariate analysis showed 3 distinct clusters of both maxillary and mandibular tooth measurements in the male and female subjects. Statistically significant differences were found between the sexes in terms of average tooth measurements, and there was significant proportionality between the maxillary and mandibular arch clusters.
Conclusion
Although the Bolton index is useful for identifying dentodental discrepancies in most patients, cluster analysis enabled the mandibular and maxillary tooth dimensions of the male and female subjects to be divided into 3 general classes (clusters) and the precise location of the discrepancies to be pinpointed.
Highlights
- •
The Bolton index is useful for identifying dentodental discrepancies.
- •
Cluster analysis enables divisions into general classes.
- •
Multivariate analysis showed 3 clusters of tooth-dimension measurements.
- •
Statistically significant tooth-measurement differences were found between the sexes.
- •
Significant proportionality was seen between maxillary and mandibular arch clusters.
To assess the degree of crowding, the dentodental relationships between the maxillary and mandibular teeth, as well as the skeletal and dentobasal relationships, need to be determined with precision. It is therefore vital to consider the dimensions of the individual teeth before treatment with a view to quantifying and localizing any dental discrepancies and planning the amount of stripping or restorative buildup required, all prerequisites for good occlusal interdigitation.
The most common method of identifying and calculating the degree of dental discrepancy, and determining whether it is in the anterior or posterior sector, is the Bolton index. In subjects with normal occlusion, Bolton reported an overall mean intermaxillary dentodental relationship from first molar to first molar of 91.3 ± 0.26, and an anterior relationship from canine to canine of 77.2 ± 0.22. However, the Bolton index has certain limitations. First and foremost, the overall and anterior ratios have wide ranges (anterior ratio, 74.5-80.4; overall ratio, 87.5-94.8), implying an equally wide range of what is considered normal in an optimal occlusion. Furthermore, the index cannot tell us the precise location of the discrepancy in a sector or quantify its severity. It also cannot account for ethnic variations, and because it relies on measurements made on plaster models, it is subject to imprecision.
Nevertheless, many authors assert that the Bolton index can be correlated with the type of malocclusion. Nie and Lin, for example, measured this parameter in 300 orthodontic patients, classified according to their malocclusion type (Class I, Class II, and Class III); they found that Class III patients tended to have higher Bolton index values than Class I patients, whereas Class II patients tended to be correlated with lower Bolton index values. Hence, according to some authors, a Class III malocclusion is correlated with a relative excess in the mandibular dentition, whereas Class II involves a relative excess in the maxillary dentition. However, in their review of the literature on tooth size discrepancies, Othman and Harradine concluded that the standard deviations of the Bolton indexes are not an ideal guide for evaluating clinically significant discrepancies in tooth dimensions. They also stated that researchers should focus more on the degree of the discrepancy, rather than just the Bolton index alone.
Whatever the case, the job of measuring tooth dimensions and the Bolton index has been made considerably easier of late because of digital gauges and their dedicated software, and the measurement of dental discrepancies will gradually become routine in clinical practice. Hence, it is timely to analyze such dimensions using the latest technological and statistical analysis tools. In particular, we set out to use these tools for the following.
- 1.
Verify the validity of the Bolton indexes in a sample of untreated naturally Class I white Italian subjects with complete dentition and minimal crowding.
- 2.
Measure the mesiodistal diameters of the tooth crowns, analyze the data via multivariate cluster analysis (men, women, maxillary teeth, and mandibular teeth), and ultimately propose a method for the precise localization and quantification of the interarch discrepancy, thereby overcoming some limitations of the Bolton index.
Material and methods
Tooth measurements were taken in a sample of 56 white Italian patients (22 men, 34 women; mean age, 27.8 years) with normal occlusion, selected according to the following criteria: Class I molar and canine relationships, complete dentition excluding the third molars, normal overjet and overbite (1-3 mm), minimal crowding (<1.5 mm, considering both arches), no previous orthodontic, prosthetic, or conservative treatment (no restorations according to Black’s classification of cavities).
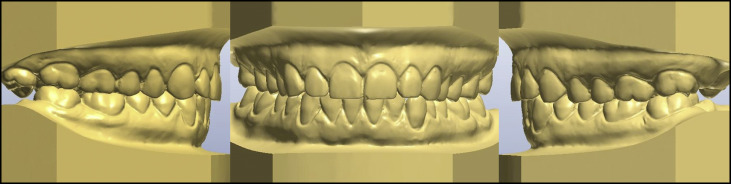
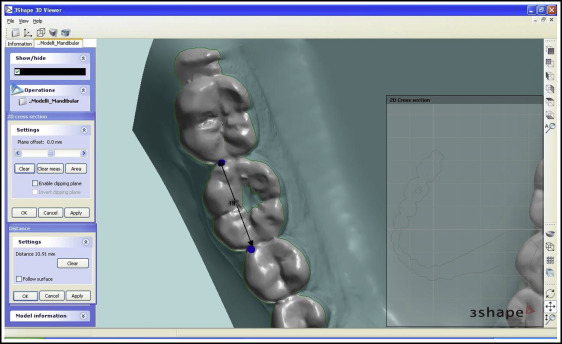
Plaster models of these 56 patients’ dentitions were scanned with a 3-dimensional (3D) 3Shape R700 scanner (Great Lakes Orthodontics, Tonawanda, NY), and the mesiodistal diameters of each crown, from second molar to second molar, were measured with the 3Shape OrthoAnalyzer software ( Fig 1 ). An example of the scanned 3D dental cast is available in Supplemental Material .
To obtain precise, reliable measurements, each tooth was measured as follows.
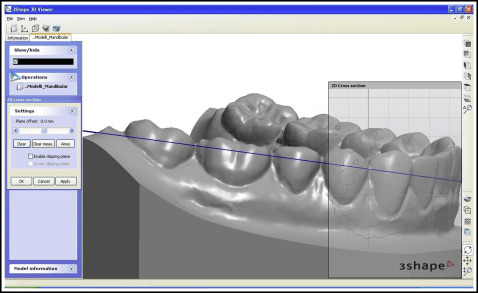
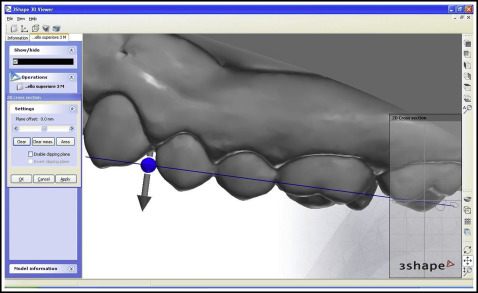
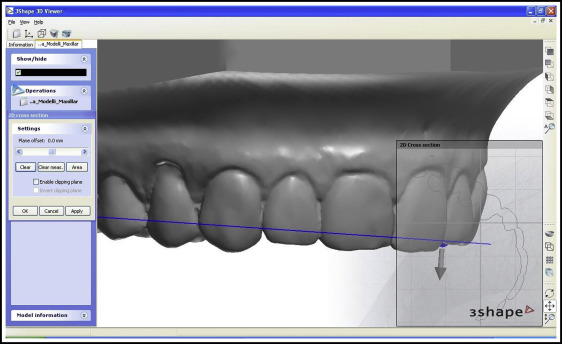
On a vestibular view of each tooth ( Fig 2 ), the “2D cross-section” tool was used to section the digital rendering; the incisors were sectioned from the distal point of contact, keeping the plane parallel to the incisal margin, and the remaining teeth were sectioned from the juncture between the most distal and most mesial points ( Figs 3 and 4 ).
On an occlusal view of each tooth, the “distance” tool was used to measure the mesiodistal diameter between the ideal points of contact, taking into account any rotation or inclination and ensuring that the points of contact in the posterior sectors were located vestibular to the central occlusal fossa ( Fig 5 ).
Each measurement was made twice by 2 investigators, and both sets of measurements were recorded on an Excel spreadsheet (Microsoft, Redmond, Wash). Male patients were numbered from 1 to 22, and female patients from 1 to 34. Each tooth was assigned a 2-figure number, according to the numbering system of the Fédération Dentaire Internationale (FDI).
Statistical analysis
The Dahlberg index was used to calculate random errors (values were between 0.03 and 0.31 mm) of the 2 sets of measurements for each tooth in each patient. A t test for independent samples was used to evaluate systematic errors, which were found to have no significant influence on the measurements ( P = 0.05). Table I shows the measurement repeatability values calculated with the Dahlberg index and the t test.
| Tooth (FDI numbers) | Mean | SD | Dahlberg’s test | t value | P value |
|---|---|---|---|---|---|
| 17 | 9.79 | 0.54 | 0.04 | −0.06 | 0.96 |
| 16 | 10.31 | 0.46 | 0.04 | 0.16 | 0.88 |
| 15 | 6.74 | 0.40 | 0.03 | 0.00 | >0.99 |
| 14 | 6.98 | 0.39 | 0.04 | −0.25 | 0.81 |
| 13 | 7.70 | 0.43 | 0.03 | −0.02 | 0.98 |
| 12 | 6.62 | 0.50 | 0.03 | −0.07 | 0.94 |
| 11 | 8.60 | 0.43 | 0.03 | 0.00 | >0.99 |
| 21 | 8.65 | 0.43 | 0.03 | 0.12 | 0.91 |
| 22 | 6.62 | 0.51 | 0.03 | 0.00 | >0.99 |
| 23 | 7.67 | 0.44 | 0.19 | −0.55 | 0.58 |
| 24 | 6.95 | 0.39 | 0.03 | −0.04 | 0.97 |
| 25 | 6.74 | 0.40 | 0.03 | 0.00 | >0.99 |
| 26 | 10.32 | 0.45 | 0.04 | 0.05 | 0.96 |
| 27 | 9.72 | 0.52 | 0.05 | 0.05 | 0.96 |
| 47 | 10.19 | 0.52 | 0.08 | −0.06 | 0.96 |
| 46 | 10.99 | 0.51 | 0.08 | 0.22 | 0.82 |
| 45 | 7.15 | 0.34 | 0.06 | 0.22 | 0.83 |
| 44 | 7.01 | 0.40 | 0.03 | −0.01 | 0.99 |
| 43 | 6.65 | 0.40 | 0.13 | −0.37 | 0.71 |
| 42 | 5.86 | 0.36 | 0.10 | −0.17 | 0.87 |
| 41 | 5.32 | 0.38 | 0.28 | −0.83 | 0.41 |
| 31 | 5.29 | 0.39 | 0.29 | −0.78 | 0.44 |
| 32 | 5.85 | 0.37 | 0.09 | −0.29 | 0.78 |
| 33 | 6.68 | 0.51 | 0.31 | 0.42 | 0.68 |
| 34 | 7.01 | 0.39 | 0.03 | 0.04 | 0.97 |
| 35 | 7.16 | 0.38 | 0.07 | 0.05 | 0.96 |
| 36 | 11.03 | 0.51 | 0.14 | 0.28 | 0.78 |
| 37 | 10.15 | 0.53 | 0.09 | −0.22 | 0.82 |
A t test was used to compare the scores of the male and female subjects for each Bolton index (overall and anterior ratios), to calculate the differences between the mean measurements for each of the 28 teeth considered in both sexes, and to compare the left and right measurements. Because of the large number of comparisons, P values were corrected for multiple comparisons using the false discovery rate method.
Subsequently, cluster analysis was applied to the data from the study sample. Essentially, cluster analysis is designed to find groups in data sets. The idea is to group items so that those in the same group, or cluster, are similar to each other, but as dissimilar as possible to items in the other clusters. The most central value of each cluster, known as the medoid, can then be identified and, with an extremely low standard deviation and possessing minimal average dissimilarity to all other values in the cluster, can be used to distinguish it from the other clusters.
Separate cluster analyses were performed on data pertaining to male and female subjects, and on the maxillary and mandibular arches of each sex, with the partitioning around medoid algorithm. The interdependence of the maxillary and mandibular clusters with respect to sex was determined using the Cochran-Mantel-Haenszel test.
Results
In the preliminary analysis, we looked for the following differences.
No significant differences in either Bolton index were found between the male and female groups: anterior ratio, t (37.51) = −0.82, P = 0.41, d = 0.24; overall ratio, t (46.38) = 0.66, P = 0.51, d = 0.18 ( Table II ).
| Bolton AR | Bolton OR | |
|---|---|---|
| Men | 0.7730 (0.03) | 0.9157 (0.02) |
| Women | 0.7788 (0.02) | 0.9155 (0.02) |
However, when teeth were measured singly, statistically significant differences between the sexes were found, as shown in Table III .
| Tooth (FDI numbers) | t value | df | Adjusted P | Cohen d |
|---|---|---|---|---|
| 15 | 2.71 | 44.42 | <0.05 | 0.74 |
| 13 | 3.87 | 44.45 | <0.01 | 1.06 |
| 24 | 2.44 | 49.82 | <0.05 | 0.65 |
| 25 | 3.41 | 48.38 | <0.01 | 0.91 |
| 27 | 2.32 | 42.38 | <0.05 | 0.64 |
| 47 | 2.83 | 44.36 | <0.05 | 0.78 |
| 46 | 3.23 | 50.51 | <0.05 | 0.85 |
| 45 | 3.73 | 42.34 | <0.01 | 1.04 |
| 44 | 3.07 | 51.07 | <0.05 | 0.80 |
| 43 | 3.57 | 52.00 | <0.01 | 0.93 |
| 33 | 2.90 | 28.96 | <0.05 | 0.89 |
| 34 | 3.05 | 52.25 | <0.05 | 0.79 |
| 35 | 4.23 | 42.53 | <0.01 | 1.18 |
| 36 | 3.00 | 49.94 | <0.05 | 0.79 |
| 37 | 2.68 | 42.18 | <0.05 | 0.75 |
At a significance threshold of α = 0.05, no significant differences between the left and right teeth were found, and we could therefore assume that the 2 hemispheres were comparable.
Cluster analysis furnished 4 distinct groups of values, and the Cochran-Mantel-Haenszel test proved the interdependence of the male and female maxillary and mandibular clusters. As in the article by Lee et al, the test showed an association between them (chi-square [4] = 32.18, P <0.001). Nevertheless, when the criterion of Kaiser was applied, it was difficult to distinguish whether there were 4 clusters or only 3. Hence, we performed the partitioning around medoid cluster analysis for both 3-group and 4-group scenarios.
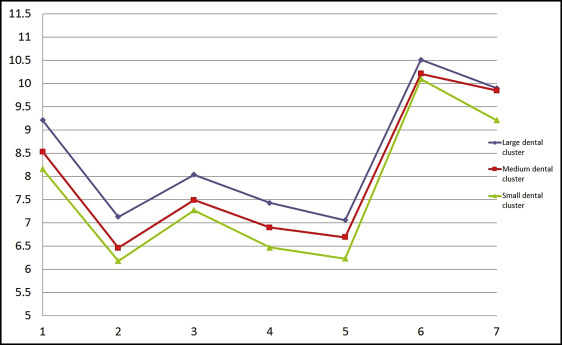
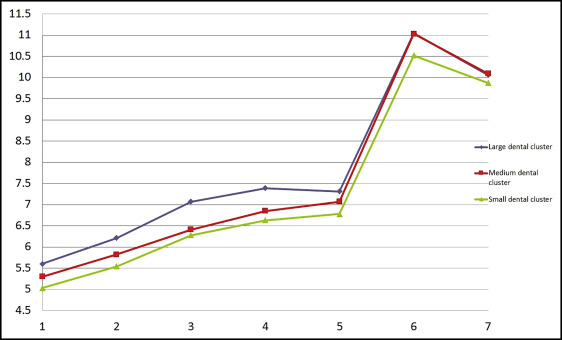
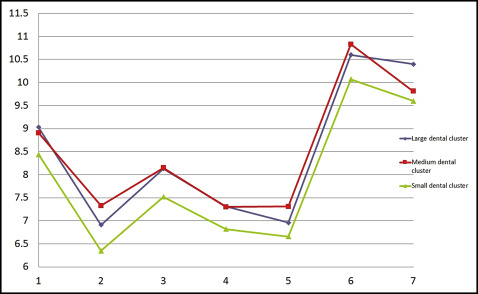
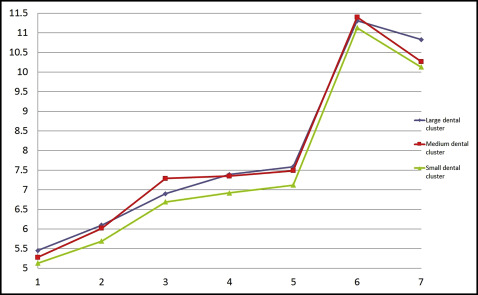
Then, through multivariate analysis using the partitioning around medoid algorithm, based on the value of the average silhouette width, we discerned 3 distinct maxillary tooth clusters and 3 distinct mandibular tooth clusters (large, medium, and small) in both male and female data sets ( Figs 6-9 ). Because no statistically significant differences were found between the left and right tooth measurements, the means of both were considered. The x-axes of Figures 6 to 9 show the tooth numbers assigned according to the FDI system, and the y-axes show the mesiodistal tooth measurements in millimeters. Medoids are represented by colored curves: blue is the large cluster, red is medium, and green is small ( Tables IV-VII ).