Introduction
Findings from early cephalometric studies on airway changes after 2-jaw orthognathic surgery have been challenged because the previous anteroposterior interpretation of airway changes can now be evaluated in 3 dimensions. The aims of this study were to use cone-beam computed tomography to quantify the nasopharynx, oropharynx, and total airway volume changes associated with skeletal movements of the maxilla and mandible in a sample of patients undergoing 2-jaw orthognathic surgery for correction of skeletal malocclusion.
Methods
Skeletal movements and airway volumes of 71 postpubertal patients (31 male, 40 female; mean age, 18.8 years) were measured. They were divided into 2 groups based on ANB angle, overjet, and occlusion (Class II: ANB, >2°; overjet, >1 mm; total, 35 subjects; and Class III: ANB, <1°; overjet, <1 mm; total, 36 subjects). Presurgical and postsurgical measurements were collected for horizontal, vertical, and transverse movements of the maxilla and the mandible, along with changes in the nasopharynx, oropharynx, and total airways. Associations between the directional movements of skeletal structures and the regional changes in airway volume were quantified. Changes in the most constricted area were also noted.
Results
Horizontal movements of D-point were significantly associated with increases in both total airway (403.6 ± 138.6 mm 3 ; P <0.01) and oropharynx (383.9 ± 127.9 mm 3 ; P <0.01) volumes. Vertical movements of the posterior nasal spine were significantly associated with decreases in total airway volume (−459.2 ± 219.9 mm 3 ; P = 0.04) and oropharynx volume (−639.7 ± 195.3 mm 3 ; P <0.01), increases in nasopharynx (187.2 ± 47.1 mm 3 ; P <0.01) volume, and decreases in the most constricted area (−10.63 ± 3.69 mm 2 ; P <0.01). In the Class III patients only, the vertical movement of D-point was significantly associated with decreases in both total airway (−724.0 ± 284.4 mm 3 ; P = 0.02) and oropharynx (−648.2 ± 270.4 mm 3 ; P = 0.02) volumes. A similar negative association was observed for the most constricted area for the vertical movement of D-point (−15.45 ± 4.91 mm 2 ; P <0.01).
Conclusions
Optimal control of airway volume is through management of the mandible in the horizontal direction and the vertical movement of the posterior maxilla for all patients. The surgeon and the orthodontist should optimally plan these movements to control gains or losses in airway volume as a result of orthognathic surgery.
Highlights
- •
Two-jaw surgery and changes in the volumetric airway were evaluated.
- •
Thirty-five Class II and 36 Class III patients had cone-beam computed tomography images.
- •
No airway changes for the Class II or Class III groups were considered significant.
- •
The association between the airway and surgical movements was quantified.
- •
Vertical and horizontal changes of the chin and vertical changes of posterior nasal spine were significant.
Cephalometric studies of the airway have aided oral surgeons for many years in making predictions about the potential and realized airway changes that occur during surgery. A meta-analysis by Mattos et al provided evidence that mandibular setback surgery alone was associated with notable decreases in the oropharyngeal airway at the level of the soft palate and at the base of the tongue. Specifically, in 2-jaw surgery including maxillary advancement and mandibular setback, an increase in airway volume was seen at the level of the posterior nasal spine (PNS), and significant decreases were seen at the level of the soft palate and at the base of the tongue. Their results also indicated that 2-jaw advancement showed a highly significant increase in oropharyngeal airway at the level of the soft palate. However, the long-term stability of these changes is controversial, with some studies claiming that these gains and losses were stable in the long term, whereas others reported that the airway adapts to these change and returns to presurgical values.
Since its introduction in 1998, cone-beam computed tomography (CBCT) has been improved, with lower costs, less radiation exposure to patients, and better accuracy in identifying the boundaries of soft tissues and air spaces. CBCT allows for segmentation and visualization of hollow structures, such as the airway in 3 dimensions, permitting the transition from lengths and angles to volumes and cross-sectional areas. Consequently, findings from early 2-dimensional evaluations on the influence of skeletal repositioning on the structures of the head and neck have been challenged with the introduction of these 3-dimensional (3D) tomographic evaluations.
Although earlier studies focused on the reliability of the new technique as well as defining normative values, changes in the airway after orthognathic surgery have become important in the comprehensive evaluation of patients. In a study evaluating pretreatment CBCT images of 140 patients, El and Palomo reported that skeletal Class II patients have smaller airway volumes when compared with Class I and Class III patients.
Two-dimensional studies have reported decreases in oropharyngeal dimensions as a result of mandibular setback surgery. However, using 3D methods, Park et al indicated no significant changes in linear, area, or volumetric measurements of the nasopharyngeal or oropharyngeal airway in patients undergoing setback surgery. Conversely, linear assessments using cephalometric radiographs of the same patients at the same times indicated decreases in all measurements of pharyngeal depth and airway space, as well as posterior movements of the soft palate, tongue, and hyoid bone. These conflicting results between the CBCT and the cephalometric analyses suggest that the absolute volume of the airway may not be significantly reduced by setback surgery, with the soft tissue pharynx expanding laterally to preserve its volume.
CBCT technology has been found to be accurate and repeatable in making skeletal measurements and measuring volumes of known value. Linear measurements are accurate to the submillimeter level, and the volumes acquired from CBCT are a near 1:1 representation of the known volume. Software programs such as Dolphin (Dolphin Imaging & Management Solutions, Chatsworth, Calif), Anatomage (San Jose, Calif), and Osirix (Pixeo, Geneva, Switzerland) have also been tested for accuracy and reliability in making volumetric predictions. Although the comparative accuracy for the programs was found to be low, the programs are reliable for repeated measurements of a given volume; thus, serial measurements of the same patient should give a reliable assessment of the changes in airway volumes.
Additionally, studies on airway changes in orthognathic surgery patients have generally focused on the surgical correction of the Class III phenotype with either 1-jaw or 2-jaw correction. The results have shown that single-jaw mandibular setback constricts total, oropharyngeal, and hypopharyngeal airways and are maintained in the long term. In patients undergoing 2-jaw mandibular setback with maxillary advancement, loss in regional airway volume was reduced, with gains seen in some regions that ameliorated the total airway losses.
The evidence of an association between the surgical movements and the resultant changes in airway volume includes conflicting views seen both within and between the cephalogram and the CBCT investigations. It is also readily apparent from a review of the literature that few data exist concerning CBCT analysis of volumetric changes in mandibular advancement groups. Further 3D studies on the volumetric changes resulting from the surgical correction of anteroposterior skeletal discrepancies are needed to confirm the results obtained thus far. Therefore, the purpose of this study was to obtain quantitative evidence of the volumetric changes occurring in the airway as a result of 2-jaw orthognathic surgery using CBCT. Specifically, we aimed to quantify the associations between the amount of surgical movement of the maxilla or the mandible in all 3 planes of space and the volumetric airway changes that occur.
Material and methods
Institutional review board approval from the University of Oklahoma was obtained before this study (#15519). Records of 71 subjects who were treated for orthognathic surgery between May 2009 and June 2013 were selected. All patients had 2-jaw orthognathic surgery in conjunction with orthodontic treatment. Thirty-five patients (15 male, 20 female) were treated for correction of Class II skeletal patterns, and 36 patients (16 male, 20 female) were treated for correction of Class III skeletal patterns. The skeletal classification was preassigned by the surgeon; however, the presurgical cephalographs of all subjects were reviewed for agreement. The prerequisites for receiving a Class II assignment were a positive ANB value, a positive overjet, and Class II posterior dental segments. The prerequisites for receiving a Class III assignment were a negative ANB value, a negative overjet, and Class III posterior dental segments. The average age of subjects in this study was 18.8 years (range, 13.5-38.7 years). The orthodontic treatment was completed by different practitioners in and around Oklahoma City. The surgical procedures were all completed by the same oral surgeon (S.M.S.), who used the same surgical and fixation protocol for each patient. To be eligible for this study, all patients had to have a CBCT scan taken before surgery (T0) and a second scan taken after the surgery (T1). The postsurgical CBCT images were taken a minimum of 4 months postsurgery to allow for reduction of tissue inflammation. The duration between T0 and T1 was, on average, 9.1 months and ranged from 4 to 14 months. All patients were operated based on the assessment of growth cessation by their orthodontists. Patients treated for the surgical correction of skeletal open bites and craniofacial deformities were excluded from this study. No patients received treatment for the correction of sleep apnea.
The T0 and T1 CBCT images were taken on either an Iluma Ultra Cone Beam CT scanner (IMTEC, Ardmore, Okla) with a field of view of 19 × 22 cm and a voxel size of 0.3 mm, or a ProMax 3D CT scanner (Planmeca, Roselle, Ill) with a field of view of 17 × 20 cm and a voxel size of 0.2 mm. All subjects had their CBCT scans taken before and after surgery on the same machine. All scans were performed at 3.8 mA for 40 seconds at 120 kV (Iluma), or variable 1 to 14 mA for 27 seconds at 90 kV (Planmeca), and the patients were instructed to breathe lightly without swallowing while in maximum intercuspation with head positions standardized by holding the Frankfort horizontal parallel to the floor while either sitting (Iluma) or standing (Planmeca). The scans were reconstructed at 0.3 mm and exported in DICOM format.
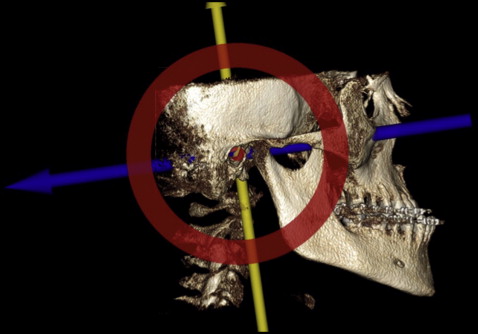
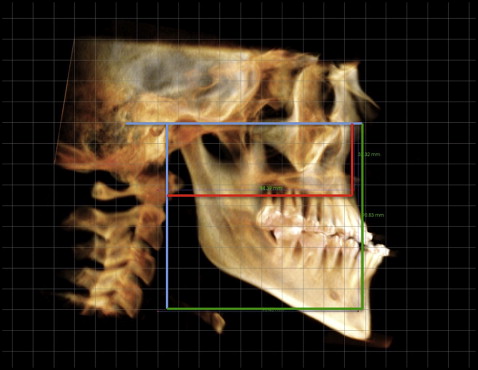
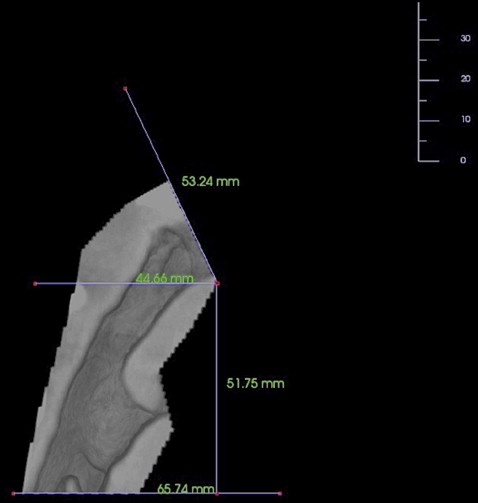
All CBCT analyses were performed by 1 examiner (P.S.H.). The DICOM files were imported into Invivo5 (Anatomage), and the orientation widget was performed in volume rendering to orient all images to the Frankfort horizontal, making it the horizontal reference plane to be used for skeletal and airway measurements ( Fig 1 ). Skeletal measurements were performed according to the methods of Park et al and McIntyre using a generated lateral cephalometric image with the Frankfort horizontal as the horizontal reference plane and a line perpendicular to the Frankfort horizontal at porion as the vertical reference plane. Changes in the horizontal and vertical positions of A-point and D-point (midpoint of the internal symphysis) were recorded with linear measurements that were perpendicular to these 2 reference planes ( Fig 2 ).
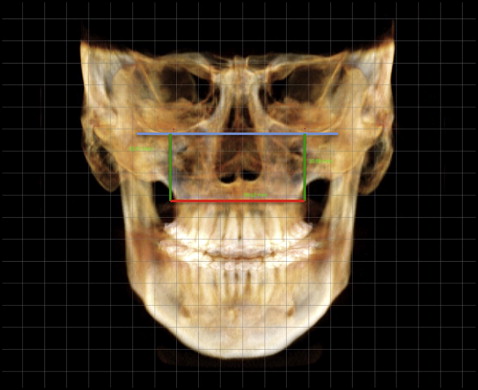
Changes in the transverse dimension of the maxilla were also measured using the frontal view of the oriented cephalometric image. Vertical lines perpendicular to the Frankfort reference plane were directed to the innermost curvature on the lateral surface of the right and left sides of the maxilla ( Fig 3 ). The distance between these 2 lines was recorded as the transverse dimension of the maxilla.
The volume-rendering tab was then selected to measure changes in the position of the posterior maxilla. PNS was used as the posterior reference point and was better visualized in gray scale with 3D image with clipping enabled. The Frankfort horizontal was used as the horizontal reference plane, and a line perpendicular to the Frankfort horizontal through the PNS was used to measure the changes before and after surgery ( Fig 4 ).
For the horizontal and vertical measurements, anterior and inferior projections of either the maxilla or the mandible received a positive value (T1-T0), and posterior and superior projections a negative value (T1-T0). For maxillary expansion, T1 to T0 measurements were taken, and a positive value indicated that the maxilla was expanded as part of the surgical correction. If a negative value was recorded, it was assumed to be the result of user error, since maxillary constriction was unlikely. All skeletal movements were measured in millimeters. If a movement was less than 1 mm in any plane, it was recorded as no change. Table I presents the directions and occurrences of skeletal movements in the Class II and Class III subjects.
| Variable | Class II | Class III | ||||
|---|---|---|---|---|---|---|
| Direction of change | Direction of change | |||||
| + | − | No change | + | − | No change | |
| Facial linear measurements (mm) | ||||||
| A-point horizontal | 6 | 20 | 9 | 18 | 6 | 12 |
| A-point vertical | 8 | 13 | 14 | 11 | 9 | 16 |
| D-point horizontal | 30 | 2 | 3 | 8 | 20 | 8 |
| D-point vertical | 13 | 11 | 11 | 12 | 15 | 9 |
| Transverse maxilla | 9 | XX | 26 | 10 | XX | 26 |
| PNS vertical | 22 | 5 | 8 | 17 | 9 | 10 |
| Pharyngeal volumes (mm 3 ) | ||||||
| Total pharynx | 16 | 19 | 0 | 14 | 21 | 1 |
| Nasopharynx | 15 | 20 | 0 | 20 | 13 | 3 |
| Oropharynx | 17 | 18 | 0 | 14 | 22 | 0 |
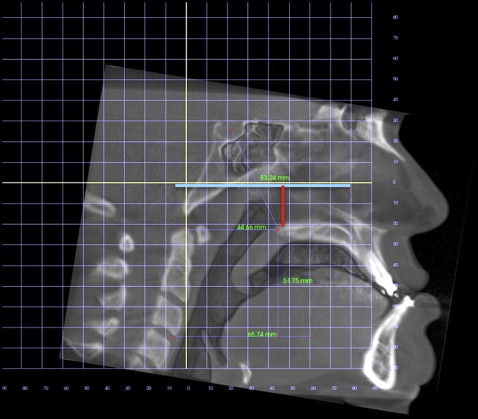
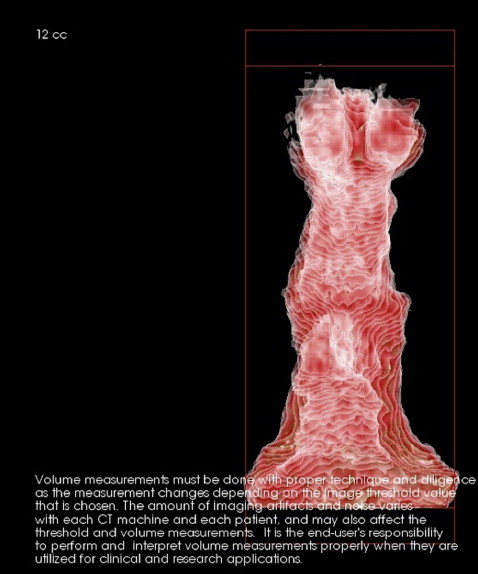
After the horizontal and vertical positions of the maxilla and the mandible were recorded, the airway analysis was performed. A plane between PNS and sella formed the superior limit of the airway, and a plane parallel to the Frankfort horizontal at vertebra C3 formed the inferior limit ( Fig 5 ). These limits were modified from the study of Park et al, who used the same inferior border but used a plane between PNS and pterygoid (PT) point as the superior plane.
The total airway (pharynx) was defined as the sum of the nasopharynx and the oropharynx. The nasopharynx was defined as the area between a plane parallel to the Frankfort horizontal through PNS and a plane passing between PNS and sella. The oropharynx was defined as the airway bounded superiorly by the plane parallel to the Frankfort horizontal passing through PNS and bounded inferiorly by a plane parallel to the Frankfort horizontal passing through vertebra C3. The most constricted area was defined as the narrowest part of the airway. The volume of each segment of the airway was calculated similarly to the study of Kim et al. Sculpting and clipping were then done to isolate the desired airway sections by removing unnecessary structures ( Fig 6 ). To maintain consistency, threshold values of the image were adjusted to −1000 and −604.3 Hounsfield units (HU) to exclude any possible hard or soft tissue structures that were retained in the image. Park et al used a range of −1024 to −600 HU for airway volume measurements. The selected range in this study was as close to those values as the Anatomage software would allow. Volume measurements were recorded in cubic millimeters. Area changes were recorded in square millimeters. Changes in airway volume for all 3 regions as well as the most constricted area were calculated as T1 minus T0. A positive value indicated that an increase in airway volume occurred; a negative value indicated a decrease in airway volume. Changes in volume less than 100 mm 3 were recorded as no change. See Table I for the occurrences and directions of the volumetric changes in the Class II and Class III patients.
Statistical analyses
A paired t test was used to compare the means between the T0 and T1 skeletal movements and airway changes. Multivariate factor analysis on all subjects checking for interactions by class was used to analyze the association between linear changes in skeletal position and changes in regional airway volumes. Multivariate analysis adjusting for classification and holding D-point vertical constant (see “Results”) was performed on all linear skeletal movements to determine the effect on each region of the airway. A univariate analysis stratified by class was then performed on the D-point vertical changes. A 2-sided 0.05 alpha level was used to define significance. Dahlberg’s formula (s=√∑d22n)
( s = ∑ d 2 2 n )
was used to calculate the error of measurements; d is the difference between the first and second measurements. The errors ranged from 0.5 to 1.2 mm for linear measurements and from 150.6 to 352.9 mm 3 for volumetric measurements. The measurement error for the area was 2.37 mm 2 . The intrarater correlation ranged from 0.77 to 0.99.
Stay updated, free dental videos. Join our Telegram channel
VIDEdental - Online dental courses


