Introduction
Correlations between cephalometric measurements are frequently assumed to represent biologic associations. However, a significant portion of such correlations might arise from purely geometric dependencies, when measurements share common landmarks. Analytic calculation of this topographic component is difficult. The purpose of this study was to propose a permutation method for evaluating the topographic component of cephalometric correlations.
Methods
The method consisted of creating a virtual sample of cephalometric tracings (landmark configurations) from the original biologic sample under investigation. Each novel landmark configuration was constructed by assigning coordinates to the cephalometric points; the coordinates of each point were taken randomly from the original sample, each from a potentially different subject. Correlation analysis was performed separately on both samples and the results compared. Biologic meaning was ascribed only when there was a significant difference in correlation values between the samples. Confidence intervals for assessing statistical significance were calculated by using a randomization approach. The method was tested on a sample of 170 radiographs to evaluate the correlation between cranial base angle (NSBa) and angles SNA and SNB, as well as between ANB angle and the Wits appraisal.
Results
No biologic association was found between ANB and Wits, or between NSBa and SNA. The biologic correlation between NSBa and SNB was statistically significant but low (r 2 = 12%).
Conclusions
Topographic associations between cephalometric measurements are ubiquitous and difficult to assess. The proposed method enables evaluation of their relative strength without the need for analytic solutions.
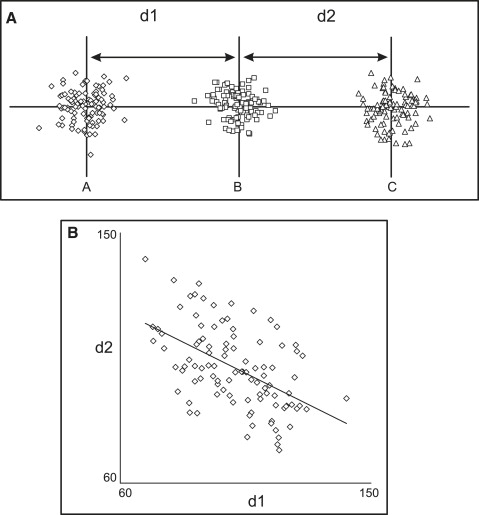
Correlations between cephalometric measurements are the consequence of 2 major components: biologic mechanisms and topographic associations. Topographic, or geometric, relationships arise when the measurements under consideration share common landmarks. Consider, for example, 3 landmarks arranged on a straight line, whose position is not dictated by any biologic factor but is completely random ( Fig 1 ). Although one might assume that the correlation between distances (d1 and d2) should be zero, it is actually statistically significant (and negative; ie, a large d1 relates to a small d2), because point B is shared; any random variation in the horizontal position of point B will affect both measurements in an opposite way. Thus, there can be statistically significant correlations between 2 measurements, even in the absence of biologic factors.
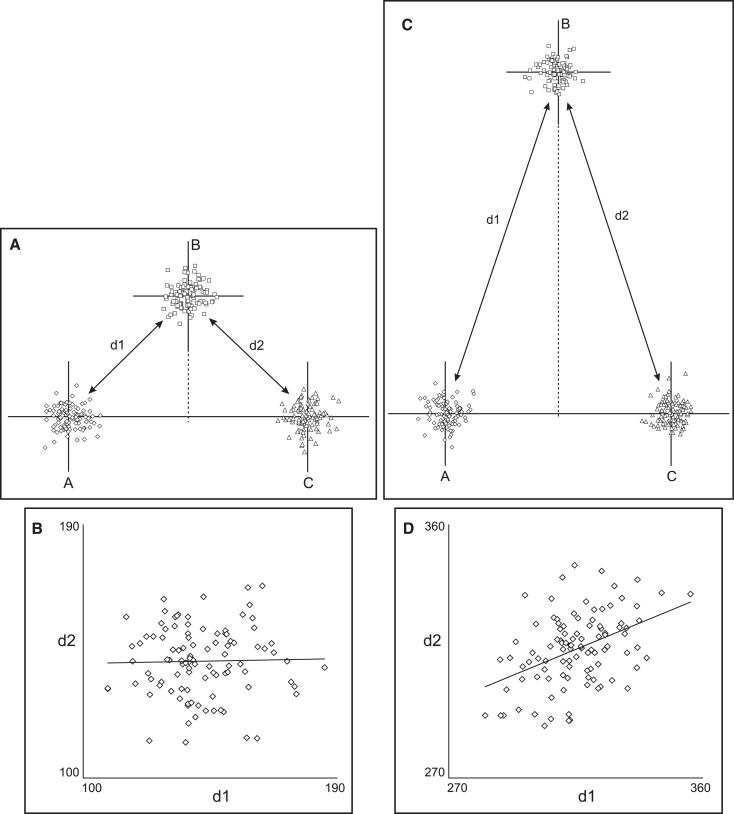
The complex nature of topographic associations can be appreciated by observing how they change when the geometry is altered. Figure 2 shows the correlations between the same 2 measurements as point B is relocated at increasing distances from the horizontal line. The correlation changes from negative ( Fig 1 ) to zero ( Fig 2 , A and B ) to positive ( Fig 2 , C and D ). An interesting observation is that the topographic association might be zero, notwithstanding the common landmark shared by the 2 measurements. In our example, this occurs because random variation in the position of the common point B does not affect the measurements in a consistent manner; horizontal variations of point B produce opposite effects on d1 and d2, whereas vertical variations affect both equivalently. A specific geometric arrangement can be created ( Fig 2 , A and B ), where the opposing effects cancel each other, and the correlation is zero.
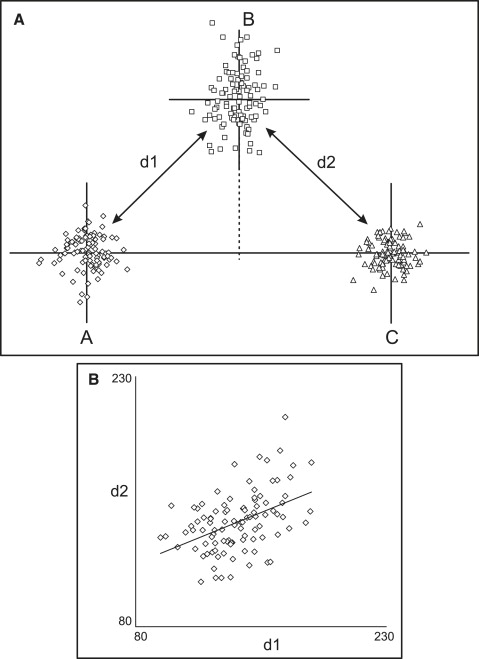
From the above, it follows that, in addition to the geometric arrangement of the points, another influencing factor is the relative amount of variation along the horizontal and vertical axes. Allowing more variation in point B’s position along the vertical axis in the situation of Figure 2 , A , will produce a positive correlation ( Fig 3 ), whereas a negative correlation will be observed if the point exhibits mostly horizontal variation in position.
Analogous situations are encountered in cephalometrics, often in more complicated and subtle ways, yet few correlation studies in the orthodontic literature have paid attention to the problem. The classic study of Solow brought the matter into the light, indicating that observed correlations are the net result of topographic and biologic factors. In an attempt to factor out the topographic correlations and thus show the true impact of biologic processes, Solow calculated analytic solutions for various landmark configurations but recognized that “the formulae for the topographical correlations are not sufficiently precise . . . due to the inability . . . to account for dissimilar variation of the reference points in different directions.” Järvinen pointed out the problem when assessing the relationship between cranial base angle and SNA, and Tollaro et al, acknowledging the difficulty, chose to avoid all measurements with explicit geometric associations.
If we accept the difficulty of calculating topographic correlations and removing them to arrive at the true biologic effect, an alternative solution arises from the insight that we could remove the biologic correlations instead. Removal of biologic factors is relatively easy because they are the property of each subject. The landmark configuration of a patient is defined by the underlying biology; to break the link between landmark position and biology, we could create a landmark configuration that is composed of landmarks from different subjects: each cephalometric point selected from a different, randomly chosen, subject of the sample. Such a procedure is a form of randomization. Randomization (permutation or bootstrap) methods provide solutions to problems that cannot be easily solved with analytic, deterministic algorithms. They rely on producing a large number of virtual individuals or samples, computed by random (or pseudo-random) processes.
In this article, a permutation method is proposed to remove biologic associations and create a virtual sample of the same geometric and variational characteristics as the original sample, retaining only the topographic associations. Any difference between the correlations found in the original sample and the constructed sample can be attributed to biologic factors.
Material and methods
Assume a sample of cephalometric radiographs and the corresponding x and y digitized coordinates of the cephalometric points. The method creates novel configurations of landmarks (data sets), each representing a virtual patient, as follows:
- •
The original landmark sets are superimposed by using a Procrustes superimposition.
- •
The coordinates of the aligned landmarks are arranged in a table, with rows representing subjects and columns representing landmark coordinates.
- •
A new landmark set is created. The coordinates of each point in the set are selected from its corresponding column by randomly drawing from all rows in the table (permutation with replacement).
- •
The previous step is repeated until a sufficiently large number of data sets has been created. These constitute the topographic sample.
The topographic sample has the following characteristics, if it contains a sufficiently large number of data sets.
- •
The averages of the original and topographic samples are identical, because the coordinates of each point were drawn randomly from the original sample. Therefore, the geometric relationship between landmarks is equivalent between samples.
- •
The positional variation of each point is also equivalent between samples, for the same reason.
- •
Any biologic association between points has been broken because each point has been assigned coordinates randomly and independently from the other points.
To illustrate the procedure, a sample of 170 radiographs was used. The sample was described previously; it consisted of 82 boys and 88 girls ranging in age from approximately 7 to 17 years, but the specific characteristics are not important for the purposes of this article. Correlations between 3 pairs of measurements were tested: (1) angle ANB and the Wits appraisal, (2) cranial base angle (nasion-sella-basion: NSBa) and angle SNA, and (3) NSBa and SNB angles. For each of these tests, 10,000 samples of 170 random virtual data sets each were constructed as described above. The Procrustes superimposition used the following points: (1) for ANB-Wits: A-point, nasion, B-point, and 2 points to define the occlusal plane (the midpoint between the first molar mesial cusps and the midpoint between the incisor tips); (2) for NSBa-SNA: basion, sella, nasion, and A-point; and (3) for NSBa-SNB: basion, sella, nasion, and B-point. Thus, only the points directly relevant to the measurements were used for aligning the data sets.
For each pair of measurements, Pearson product moment correlation coefficients (r) were computed for the original sample and the 10,000 random samples. The correlation coefficients of the 10,000 samples were sorted in ascending order. The first 250 and last 250 correlations were removed, and the remaining 95% constituted the 95% CI. If the correlation of the original sample fell outside this 95% CI, it was assumed to exhibit some biologic significance; otherwise, it was considered purely topographic. The rank of the original sample within the list of correlation coefficients could be used to compute an exact P value.
Procrustes superimposition, permutation of point coordinates, construction of the virtual data sets, and calculation of correlation coefficients were performed by using Viewbox software (version 4, dHAL Software, Kifissia, Greece).
Stay updated, free dental videos. Join our Telegram channel
VIDEdental - Online dental courses


