Introduction
To understand the growth patterns of skeletal open bite and deepbite, we present observations from 9 years of pure longitudinal data based on lateral cephalometric radiographs using mixed-effects regression model analysis.
Methods
In total, 51 children (14 years old) with extreme values for the ratio of lower anterior facial height to total anterior facial height were assigned to 1 of 2 groups: a skeletal open-bite group (11 boys, 14 girls) or a skeletal deepbite group (14 boys, 12 girls). Measurements of total anterior facial height, upper anterior facial height, lower anterior facial height, total posterior facial height, ramus height, and ratio of lower anterior facial height to total anterior facial height were obtained for all subjects. All data were analyzed and interpreted using a mixed-effects regression model analysis with random effects.
Results
From these 4 groups at 14 years old, statistically significant differences were observed between the groups when subjects of the same sex were compared; however, statistical significance was not reached between subjects of opposite sexes in each group. Morphologic differences were clearly evident from the start and became more pronounced with age. There were statistical significances in the initial values and increases with age in all 6 variables except for increases with age in the ratio of lower anterior facial height to total anterior facial height. Statistical significance was also reached for morphologic differences between the annual increases in the ratio of lower anterior facial height to total anterior facial height and lower anterior facial height. In general, individual random variability was high in all variables when compared with the annual changes over time.
Conclusions
Divergent patterns were established early and became more pronounced with age, with anterior facial height dimensions primarily contributing to these differences. Individual variations were so pronounced that caution is recommended for all clinical decisions.
Orthodontic practice is founded on understanding the growth of the face, not only where growth occurs but also when it occurs or ceases to occur. The pattern of vertical growth as a component of facial growth has become a topic of great interest to orthodontists, because failure of its control often causes compromised results, and extreme vertical deficiency or excess requires surgical intervention. Vertical skeletal patterns have frequently been studied in the context of overbite in the orthodontic literature, although controversy still exists regarding the relationship between these 2 phenomena. Dentoalveolar compensations for abnormal vertical patterns have also been demonstrated.
Skeletal open bite and skeletal deepbite—alternatively termed long-face syndrome or hyperdivergent, and short-face syndrome or hypodivergent—are 2 distinct facial morphologies associated with the most common form of vertical dysplasia. To better understand the growth patterns in patients with vertical dysplasia according to the morphologic classifications, an analysis of adequate longitudinal samples would be particularly relevant. However, only a limited number of such longitudinal studies have evaluated vertical facial growth patterns to date, because these data are difficult to collect. Moreover, most study cohorts were composed of subjects of European descent.
Of the several studies mentioned above, the excellent quantification study by Nanda demonstrates several linear dimensions of facial vertical change in extreme facial types between childhood and early adulthood on a longitudinal basis. In this study, the subjects were recruited from the Denver Child Growth Study, which included 250 subjects. Of these, 32 were ultimately selected and divided equally into 4 groups—each with 8 subjects—of the most extreme values at both ends of the distribution: open-bite female, open-bite male, deepbite female, and deepbite male. We then statistically calculated the average values for the measured parameters, graphically concluding that whereas the anterior dimensions of the face have morphologically divergent patterns of development, no variation in the posterior dimension was observed between the 2 groups. Furthermore, this study provided many valuable insights and meaningful clinical implications regarding vertical growth patterns.
Although longitudinal data provide significantly more information than cross-sectional counterparts, they are not easy to interpret properly. To develop a more general approach to analyzing longitudinal data with more realistic assumptions regarding the longitudinal change and the associated missing data, a wide variety of more rigorous approaches has been developed. Of these, the mixed-effects regression model is widely used because it can determine individual random variability that is not explained by conventional descriptive statistics.
The aim of this study was to compare facial growth changes among patients with hypodivergent and hyperdivergent patterns. Specifically, we analyzed longitudinal cephalometric data from children with those patterns from the ages of 6 to 14 years. Moreover, unlike prior studies, we used the mixed-effects regression model to analyze data from Korean adolescents.
Material and methods
This study was conducted under the auspices of the Korean Dental Growth Study, which occurred from 1995 to 2003, with the exception of 1999, when the study was temporarily suspended because of financial problems. All subjects were of Korean origin and from the northern province of Gyeonggi-do. In total, 410 subjects were enrolled, of whom 223 had full sets of cephalometric radiographs during the study period. All subjects were healthy and without systemic diseases or developmental anomalies. Lateral cephalometric radiographs from these children (107 boys, 116 girls) were made annually from the ages of 6 to 14 years, with the exception of the 10th year. No subject had received any treatment that interfered with growth or had a history of orthodontic treatment before or during the observation period. The parents or guardians of all subjects provided written informed consent. Before enrollment, the institutional review board for the protection of human subjects of the School of Dentistry, Seoul National University, reviewed and approved the research protocol (S-D2010013).
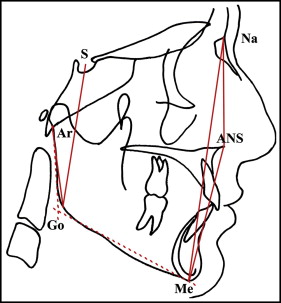
All radiographs were traced by 1 observer (Y.S.P.) to eliminate interexaminer variability and were analyzed using Vceph (version 6.0; Osstem, Seoul, Korea). As in the study of Nanda, a total of 5 linear distances were measured for use as discriminators of vertical facial dysplasia. The measured distance parameters were defined as follows ( Fig 1 ): (1) total anterior face height, nasion to menton; (2) upper anterior face height, nasion, to anterior nasal spine; (3) lower anterior face height, anterior nasal spine to menton; (4) total posterior face height, sella to gonion; and (5) ramal height, articulare to gonion.
In selecting hypodivergent (deepbite) and hyperdivergent (open bite) subjects, the protocol from a previous study was followed with some modification. We selected the records at age 14 years and then looked back to see how early the growth pattern was established. One radiograph obtained at 14 years of age was used for the final measurements, since it represented each subject’s most mature state. All subjects were selected from the aforementioned cohort of 223 subjects on the basis of the ratio of lower anterior face height to total anterior face height, with some exhibiting the most extreme values at both ends of the distribution (ie, >1 SD from the mean) were selected to create 4 groups, instead of 8 subjects in each group as in the previous study. In the end, 11 boys with open bite, 14 girls with open bite, 14 boys with deepbite, and 12 girls with deepbite were selected for this study. The terms “open” and “deep” were used for the sake of comparison with the study of Nanda, although these do not indicate dental open bite or deepbite but, rather, the skeletal tendency.
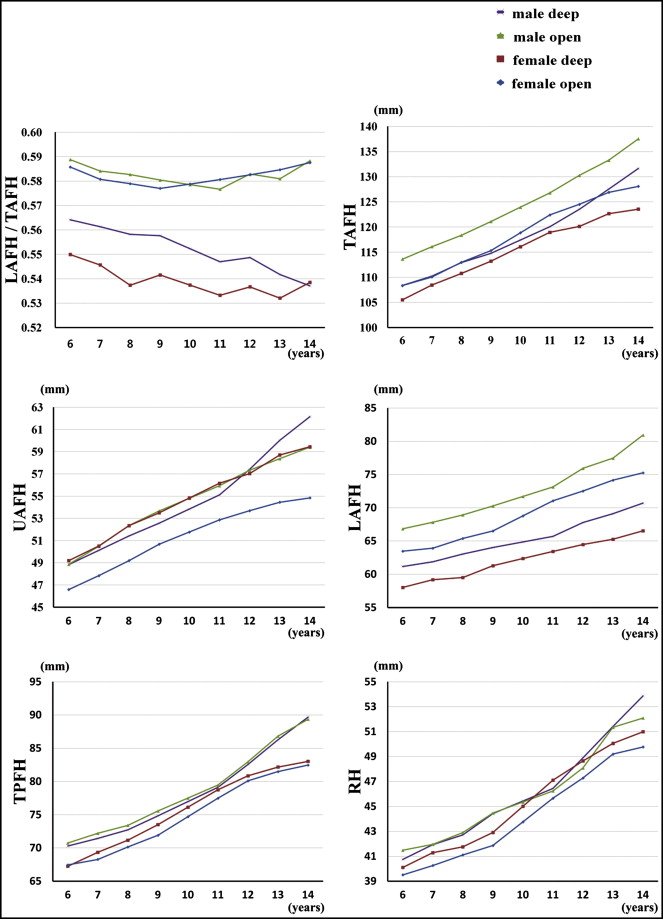
All data were analyzed by both graphic and statistical methods to present individual as well as group findings ( Fig 2 ). Descriptive statistics for each group were calculated at each age to characterize yearly absolute values and relative percentages to the final measurements of the 5 dimensions and 1 ratio between the ages of 6 and 14 years. Since the serial measurements were correlated according to the individual subjects, a mixed-effects regression model was used for the following analysis model: y ijk = μ + β 1 sex i + β 2 group ij + β 3 age ijk + β 4 sex i * group ij + β 5 sex i * age ijk + β 6 group ij * age ijk + β 7 sex i * group ij * age ijk + b ij + b ij2 * age ij + e ijk , where μ represents total mean; β 1 , sex effect; β 2 , group effect; β 3 , age effect; β 4 , interaction effect between sex and group; β 5 , interaction effect between sex and age; β 6 , interaction effect between group and age; β 7 , interaction effect among sex, group, and age; and b i (i = 1, 2, . . ., 51), the random effect by each subject. Comparisons between sexes and groups at each age were performed. All statistical analyses were performed using the language R, and P values less than 0.05 were predetermined as statistically significant, although they were also assessed at the 0.01 level of confidence.
Results
Intraexaminer reliability coefficients ranged from 0.965 to 0.983. In terms of root mean square values, the random errors of estimation were less than 0.42 mm. No variables were significantly different between the test and retest measurements.
The means, standard deviations, and ranges of the ratio of lower anterior face height to total anterior face height at the age of 14 years are shown in Table I for the entire cohort of 223 subjects and the 4 selected groups. From the 4 groups, statistically significant differences were observed between the same-sex groups, although not between the opposite sexes within each group. Descriptive statistics at each age regarding the 5 measured distance variables as well as the ratio of lower anterior face height to total anterior face height are reported in Tables II-IV .
| Boys | Girls | |||||||
|---|---|---|---|---|---|---|---|---|
| n | Mean | SD | Range | n | Mean | SD | Range | |
| Deepbite | 14 | 0.537 | 0.017 | 0.523-0.542 | 12 | 0.539 | 0.010 | 0.526-0.553 |
| Open bite | 11 | 0.588 | 0.007 | 0.581-0.601 | 14 | 0.588 | 0.006 | 0.580-0.603 |
| Total subjects | 107 | 0.561 | 0.018 | 0.523-0.601 | 116 | 0.561 | 0.018 | 0.526-0.603 |
| Group | Male open bite | Female open bite | Male deepbite | Female deepbite | ||||
|---|---|---|---|---|---|---|---|---|
| Age | Mean | SD | Mean | SD | Mean | SD | Mean | SD |
| Total anterior facial height | ||||||||
| 6 ∗,† | 113.60 | 5.48 | 108.34 | 3.82 | 108.39 | 3.38 | 105.51 | 2.57 |
| 7 ∗,† | 116.09 | 5.51 | 110.06 | 4.27 | 110.22 | 4.42 | 108.46 | 3.57 |
| 8 ‡,§ | 118.36 | 6.39 | 112.97 | 4.28 | 112.91 | 4.66 | 110.76 | 3.40 |
| 9 ∗,† | 121.08 | 6.35 | 115.30 | 4.45 | 114.76 | 4.45 | 113.20 | 3.55 |
| 11 ∗,§ | 126.79 | 6.87 | 122.39 | 5.09 | 120.06 | 5.36 | 118.94 | 4.64 |
| 12 ∗,† | 130.26 | 7.68 | 124.50 | 4.86 | 123.52 | 5.53 | 120.11 | 3.78 |
| 13 †,‡ | 133.28 | 8.64 | 126.89 | 5.82 | 127.54 | 5.58 | 122.65 | 3.71 |
| 14 ∗,† | 137.54 | 8.96 | 128.08 | 5.11 | 131.64 | 5.50 | 123.54 | 3.54 |
| Upper anterior facial height | ||||||||
| 6 | 48.86 | 3.75 | 46.59 | 1.57 | 48.84 | 1.69 | 49.19 | 1.99 |
| 7 | 50.48 | 2.48 | 47.84 | 2.34 | 50.12 | 2.68 | 50.51 | 2.37 |
| 8 | 52.36 | 2.74 | 49.19 | 2.60 | 51.42 | 2.08 | 52.34 | 1.85 |
| 9 | 53.67 | 2.39 | 50.67 | 2.26 | 52.56 | 1.67 | 53.50 | 1.99 |
| 11 | 55.94 | 3.15 | 52.86 | 2.95 | 55.11 | 1.81 | 56.16 | 1.88 |
| 12 | 57.33 | 2.48 | 53.69 | 3.13 | 57.41 | 3.08 | 57.03 | 1.81 |
| 13 ∗,† | 58.37 | 2.90 | 54.45 | 3.37 | 60.03 | 2.75 | 58.71 | 1.35 |
| 14 ∗,† | 59.41 | 3.27 | 54.84 | 2.72 | 62.15 | 3.34 | 59.45 | 1.17 |
| Lower anterior facial height | ||||||||
| 6 ∗,† | 66.85 | 2.76 | 63.47 | 2.91 | 61.16 | 2.83 | 58.02 | 1.93 |
| 7 ∗,† | 67.82 | 3.78 | 63.92 | 2.80 | 61.88 | 3.41 | 59.18 | 2.13 |
| 8 ∗,† | 68.93 | 4.28 | 65.39 | 2.73 | 63.05 | 3.56 | 59.51 | 2.30 |
| 9 ∗,† | 70.29 | 4.24 | 66.53 | 3.23 | 64.03 | 4.00 | 61.30 | 2.36 |
| 11 ∗,§ | 73.13 | 4.63 | 71.06 | 3.32 | 65.70 | 4.23 | 63.43 | 2.89 |
| 12 ∗,† | 75.94 | 5.06 | 72.52 | 3.12 | 67.78 | 4.20 | 64.47 | 2.68 |
| 13 ∗,† | 77.48 | 6.20 | 74.16 | 3.56 | 69.12 | 4.23 | 65.28 | 3.34 |
| 14 ∗,† | 80.94 | 5.77 | 75.26 | 3.27 | 70.71 | 3.77 | 66.55 | 2.66 |
∗ Statistically significant differences between groups ( P <0.01).
† statistically significant differences between sexes ( P <0.01).
‡ statistically significant differences between groups ( P <0.05).
§ statistically significant differences between sexes ( P <0.05).
| Group | Male open bite | Female open bite | Male deepbite | Female deepbite | ||||
|---|---|---|---|---|---|---|---|---|
| Age | Mean | SD | Mean | SD | Mean | SD | Mean | SD |
| Total anterior facial height | ||||||||
| 6 ∗ | 70.75 | 4.12 | 67.45 | 3.09 | 70.29 | 3.01 | 67.26 | 2.70 |
| 7 ∗ | 72.21 | 4.12 | 68.28 | 3.17 | 71.44 | 2.60 | 69.35 | 2.87 |
| 8 † | 73.41 | 4.93 | 70.15 | 3.43 | 72.73 | 2.48 | 71.17 | 2.92 |
| 9 † | 75.56 | 5.30 | 71.91 | 3.77 | 74.84 | 2.91 | 73.51 | 3.71 |
| 11 † | 79.46 | 6.02 | 77.49 | 5.01 | 79.11 | 3.97 | 78.75 | 4.51 |
| 12 † | 82.96 | 5.54 | 80.10 | 4.97 | 82.56 | 4.58 | 80.85 | 3.69 |
| 13 ∗ | 86.82 | 7.47 | 81.49 | 4.76 | 86.26 | 4.70 | 82.17 | 4.51 |
| 14 ∗ | 89.36 | 6.47 | 82.47 | 4.41 | 89.69 | 4.59 | 83.03 | 4.42 |
| Ramus height | ||||||||
| 6 | 41.49 | 2.87 | 39.51 | 3.15 | 40.75 | 2.52 | 40.11 | 2.56 |
| 7 | 41.96 | 2.53 | 40.26 | 2.57 | 41.94 | 2.55 | 41.29 | 2.87 |
| 8 | 42.90 | 2.77 | 41.11 | 2.87 | 42.72 | 2.48 | 41.76 | 3.24 |
| 9 | 44.47 | 3.44 | 41.87 | 2.72 | 44.43 | 3.08 | 42.91 | 3.01 |
| 11 | 46.24 | 3.39 | 45.66 | 3.77 | 46.44 | 3.07 | 47.11 | 4.36 |
| 12 | 48.09 | 3.34 | 47.28 | 3.39 | 48.90 | 3.80 | 48.65 | 4.27 |
| 13 | 51.35 | 4.15 | 49.20 | 3.89 | 51.41 | 4.26 | 50.06 | 6.05 |
| 14 † | 52.09 | 4.28 | 49.77 | 3.59 | 53.86 | 4.75 | 50.99 | 5.79 |
∗ Statistically significant differences between sexes ( P <0.01).
† statistically significant differences between sexes ( P <0.05).
| Group | Male open bite | Female open bite | Male deepbite | Female deepbite | ||||
|---|---|---|---|---|---|---|---|---|
| Age | Mean | SD | Mean | SD | Mean | SD | Mean | SD |
| 6 ∗ | 0.589 | 0.014 | 0.586 | 0.014 | 0.564 | 0.016 | 0.550 | 0.013 |
| 7 ∗ | 0.584 | 0.014 | 0.581 | 0.012 | 0.561 | 0.018 | 0.546 | 0.010 |
| 8 ∗,† | 0.583 | 0.027 | 0.579 | 0.015 | 0.558 | 0.014 | 0.537 | 0.014 |
| 9 ∗ | 0.580 | 0.013 | 0.577 | 0.013 | 0.558 | 0.020 | 0.542 | 0.014 |
| 11 ∗ | 0.576 | 0.015 | 0.581 | 0.012 | 0.547 | 0.017 | 0.533 | 0.012 |
| 12 ∗ | 0.583 | 0.014 | 0.583 | 0.014 | 0.549 | 0.021 | 0.536 | 0.011 |
| 13 ∗ | 0.581 | 0.016 | 0.58 | 0.015 | 0.542 | 0.017 | 0.532 | 0.016 |
| 14 ∗ | 0.588 | 0.008 | 0.59 | 0.006 | 0.537 | 0.017 | 0.538 | 0.010 |
Stay updated, free dental videos. Join our Telegram channel
VIDEdental - Online dental courses


