Introduction
There is little valid information about factors that influence a patient’s choice of an orthodontic practice. The aim of this study was to determine what orthodontists consider the most important factors for prospective adult patients or parents of prospective adolescent patients when choosing an orthodontic practice.
Methods
We randomly selected 450 orthodontists from the American Association of Orthodontists’ membership list, stratified to represent various regions. They were sent 2 questionnaires: 1 for prospective adult patients (44 questions) and 1 for parents of prospective adolescent patients (51 questions). The orthodontists were asked to answer as they thought their potential patients would. Responses were given on a visual analog scale.
Results
One hundred twenty-three orthodontists returned the questionnaires. The 3 highest scores were (for adult patients): “a doctor who makes you feel comfortable,” a doctor with a “caring attitude,” and “the doctor’s overall reputation.” For the parents of adolescents, orthodontists thought that “a doctor with a caring attitude,” “who makes you feel comfortable,” and “a staff with a caring attitude” were most important.
Conclusions
Orthodontists thought that the personal characteristics of the doctor and the staff were the most important factors affecting a potential patient’s decision in choosing a practice.
The factors that lead a prospective adult patient or the parent of a prospective adolescent patient to choose an orthodontic practice have not been widely investigated. Most parents of adolescent patients received a recommendation from either their general dentist or a friend or relative. Nonetheless, other factors might influence their decision; many parents, for example, visit more than 1 office. Furthermore, although patients learn about an orthodontic office from a referral, they report that the primary reason that they chose their orthodontist was the orthodontist’s “caring attitude” and “good reputation.”
Previous studies that examined patient preferences did not primarily use quantitative data to examine the relative importance that prospective patients and decision makers place on these factors and how they influence the choice of an orthodontist. Moreover, they were generally retrospective—ie, conducted on patients who had already chosen their orthodontist and were in treatment, or had already completed treatment. In addition, the validity and reliability of the instruments used were not reported. There is even less formal information available about how orthodontists view the effect of the characteristics of the orthodontist, practice, and staff on determining a patient’s choice of orthodontic practices.
A questionnaire to elicit from parents of adolescent patients and from adult patients information about the relative importance of doctor, staff, and practice characteristics in choosing an orthodontic practice has previously been shown to be valid and reliable. The purpose of our study was to determine orthodontists’ perceptions and opinions on the relative importance of these characteristics to the parents of prospective adolescent patients and prospective adult patients who are visiting their practices for the first time.
Material and methods
The study was approved by the Biomedical Sciences Institutional Review Board of Ohio State University. The names and addresses of 450 orthodontists were selected from the 2009 edition of the American Association of Orthodontists’ Membership Directory. Names were selected randomly from each state in approximate relationship to the number of orthodontists listed.
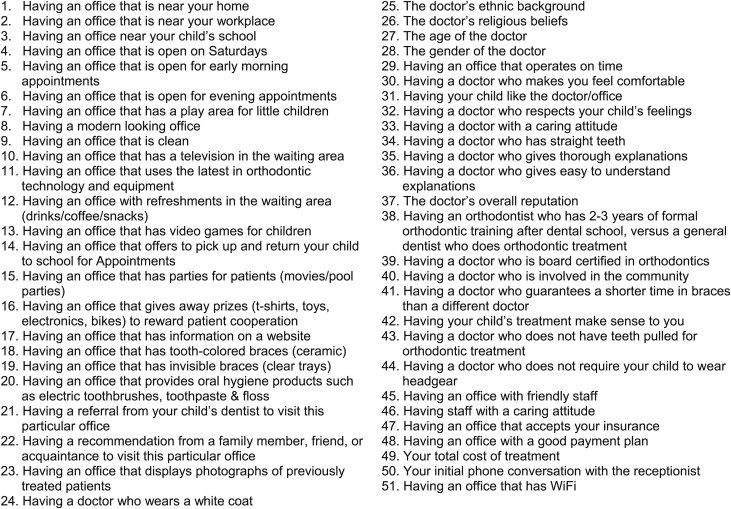
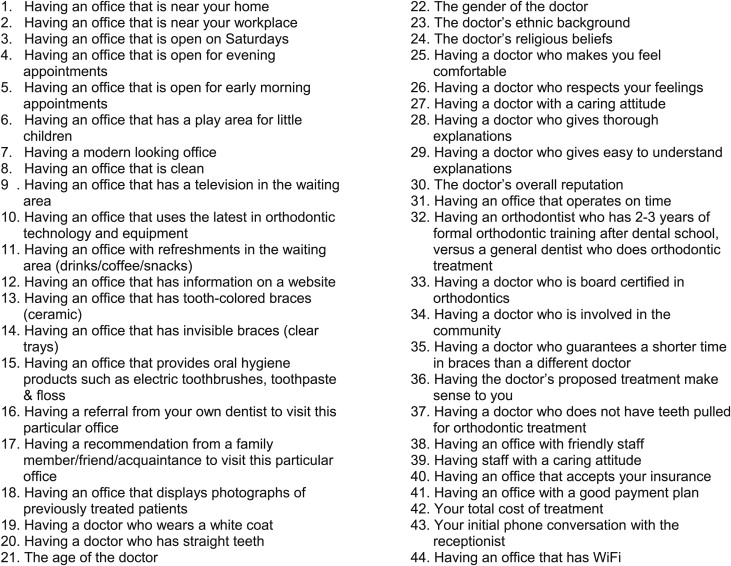
Two questionnaires, 1 for parents (51 questions, Fig 1 ) and 1 for adult patients (44 questions, Fig 2 ), were sent to each orthodontist’s listed office. The orthodontists were requested to respond to the 2 questionnaires as if they were the parent of a prospective adolescent patient and a prospective adult patient, visiting the practice for the first time. The questions were presented as follows: an office characteristic was presented and the orthodontist was asked to place a mark on a 100-mm line that corresponded to the level of importance they thought the patient or parent placed on the characteristic when selecting an orthodontist. The scale was anchored on the left side (0 mm) with “not important at all” and on the right side (100 mm) with “most important.” The visual analog scale (VAS) has been shown to be a valid and reliable method of measurement; it is often used to quantify an attitude or perception across a range of subjective values.
The orthodontists provided additional information about sex and practice location (urban, suburban, or rural). A postage-paid return envelope was included with the questionnaires.
Mean (± 1 SD) response length on the VAS scale was calculated for all respondents for all questions for the 2 questionnaires, and for the subclasses of sex (male, female) and practice location (rural, suburban, urban). No attempt was made to analyze the interaction between sex and practice location. Mean data for all respondents for each questionnaire were used to identify the question with the median response.
Results
One hundred twenty-three orthodontists returned the questionnaires. All responses were measured and entered. Not all orthodontists supplied all demographic data or responded to all questions. There was no attempt to replace missing data. Twenty-eight orthodontists identified themselves as female, and 66 as male. Fifteen orthodontists described their practice location as rural, 64 as suburban, and 17 as urban.
The 10 factors that orthodontists thought the parents of potential adolescent patients and potential adult patients would find most important (greatest mean VAS length) and the 10 least important (shortest mean VAS length) factors are listed in Tables I and II . The mean values for these 20 questions and the upper and lower 95% confidence boundaries are shown in Figures 1 and 2 . In addition, the question with the median VAS value (or for the adult patient questionnaire with 44 questions, one of the 2 on either side of the median value) is also included. The lengths of the mean VAS responses of each of the 10 highest and least important reasons were significantly different from the length of the VAS response to the median question ( P <0.001, compared with the respective median question by using repeated-measures analysis of variance [ANOVA] and the Dunnett-Hsu test).
| All (n = 123) | Female (n = 28) | Male (n = 66) | Rural (n = 15) | Suburban (n = 64) | Urban (n = 17) | ||||||||
|---|---|---|---|---|---|---|---|---|---|---|---|---|---|
| Parents | Question | Mean | SD | Question | Mean | Question | Mean | Question | Mean | Question | Mean | Question | Mean |
| Top 10 | |||||||||||||
| 1 | 33 | 90.1 | 8.4 | 33 | 93.9 | 33 | 88.8 | 33 | 88.5 | 33 | 90.9 | 48 | 89.0 |
| 2 | 30 | 89.7 | 8.1 | 32 | 93.3 | 30 | 88.7 | 37 | 87.7 | 30 | 90.8 | 33 | 88.7 |
| 3 | 46 | 89.4 | 8.5 | 31 | 93.0 | 46 | 88.6 | 46 | 87.7 | 46 | 90.5 | 32 | 88.0 |
| 4 | 32 | 89.2 | 9.0 | 22 | 92.9 | 32 | 87.8 | 36 | 87.3 | 32 | 90.0 | 42 | 87.2 |
| 5 | 45 | 88.3 | 8.5 | 30 | 92.3 | 45 | 87.5 | 30 | 87.3 | 45 | 89.3 | 22 | 86.9 |
| 6 | 31 | 88.0 | 9.7 | 36 | 91.9 | 37 | 86.8 | 45 | 87.1 | 9 | 89.1 | 30 | 86.9 |
| 7 | 37 | 87.9 | 9.9 | 9 | 91.2 | 36 | 86.2 | 32 | 87.0 | 31 | 88.7 | 31 | 86.8 |
| 8 | 36 | 87.8 | 9.4 | 46 | 91.2 | 31 | 86.1 | 35 | 86.6 | 37 | 88.6 | 36 | 86.6 |
| 9 | 42 | 87.7 | 10.2 | 45 | 90.8 | 42 | 86.0 | 31 | 85.9 | 36 | 88.2 | 45 | 86.2 |
| 10 | 9 | 87.7 | 11.2 | 35 | 90.2 | 9 | 85.8 | 48 | 85.5 | 22 | 87.8 | 46 | 86.2 |
| Middle values | 6 | 63.3 | 25.5 | 77.2 | 61.6 | 63.3 | 67.7 | 63.5 | |||||
| Bottom 10 | |||||||||||||
| 10 | 4 | 41.1 | 27.5 | 10 | 39.5 | 16 | 41.1 | 16 | 39.8 | 16 | 39.0 | 13 | 44.7 |
| 9 | 2 | 39.3 | 28.1 | 28 | 35.7 | 4 | 37.4 | 12 | 37.6 | 2 | 35.3 | 12 | 43.8 |
| 8 | 12 | 35.3 | 25.1 | 12 | 32.0 | 12 | 37.2 | 15 | 31.3 | 12 | 33.0 | 14 | 39.6 |
| 7 | 14 | 32.7 | 26.5 | 14 | 31.5 | 14 | 35.2 | 4 | 30.9 | 14 | 31.6 | 28 | 36.3 |
| 6 | 28 | 28.7 | 25.5 | 15 | 24.3 | 15 | 28.2 | 27 | 29.1 | 28 | 28.8 | 2 | 35.4 |
| 5 | 15 | 26.0 | 21.7 | 51 | 23.1 | 28 | 25.7 | 51 | 27.7 | 15 | 24.2 | 15 | 34.7 |
| 4 | 25 | 25.4 | 23.7 | 2 | 22.7 | 25 | 24.4 | 24 | 24.9 | 51 | 23.4 | 25 | 29.4 |
| 3 | 24 | 22.1 | 22.2 | 24 | 21.6 | 51 | 22.9 | 28 | 20.9 | 25 | 23.0 | 26 | 21.2 |
| 2 | 51 | 21.9 | 19.6 | 25 | 20.6 | 24 | 22.2 | 25 | 20.4 | 24 | 22.5 | 24 | 20.2 |
| 1 | 26 | 18.2 | 21.1 | 26 | 14.4 | 26 | 18.5 | 26 | 15.1 | 26 | 17.5 | 51 | 17.8 |
| All (n = 123) | Female (n = 28) | Male (n = 66) | Rural (n = 15) | Suburban (n = 64) | Urban (n = 17) | ||||||||
|---|---|---|---|---|---|---|---|---|---|---|---|---|---|
| Adults | Question | Mean | SD | Question | Mean | Question | Mean | Question | Mean | Question | Mean | Question | Mean |
| Top 10 | Question | Mean | SD | Question | Mean | Question | Mean | Question | Mean | Question | Mean | Question | Mean |
| 1 | 27 | 89.9 | 8.9 | 27 | 93.6 | 27 | 88.5 | 8 | 89.5 | 30 | 90.9 | 27 | 86.9 |
| 2 | 30 | 89.1 | 9.3 | 30 | 93.1 | 30 | 87.8 | 27 | 89.2 | 27 | 90.9 | 41 | 85.8 |
| 3 | 25 | 88.7 | 9.9 | 25 | 92.6 | 8 | 87.4 | 41 | 88.5 | 25 | 89.9 | 29 | 85.4 |
| 4 | 8 | 88.4 | 9.5 | 26 | 92.4 | 39 | 87.0 | 30 | 88.1 | 8 | 89.5 | 28 | 85.1 |
| 5 | 26 | 88.4 | 9.1 | 28 | 92.3 | 29 | 86.9 | 39 | 87.9 | 28 | 89.3 | 26 | 84.9 |
| 6 | 28 | 88.3 | 10.3 | 8 | 90.0 | 25 | 86.8 | 29 | 86.8 | 26 | 89.2 | 25 | 84.4 |
| 7 | 29 | 87.6 | 10.6 | 29 | 89.8 | 36 | 86.3 | 25 | 86.7 | 39 | 88.6 | 39 | 84.2 |
| 8 | 39 | 87.6 | 9.1 | 39 | 89.8 | 26 | 86.3 | 26 | 86.6 | 29 | 88.5 | 36 | 83.6 |
| 9 | 36 | 86.5 | 11.6 | 17 | 89.5 | 28 | 86.3 | 28 | 86.1 | 36 | 87.8 | 30 | 83.5 |
| 10 | 41 | 85.5 | 11.7 | 41 | 88.8 | 38 | 85.3 | 38 | 84.2 | 38 | 86.7 | 17 | 83.4 |
| Median values | 1 | 66.8 | 18.9 | 68.3 | 66.3 | 60.7 | 70.5 | 57.8 | |||||
| Bottom 10 | |||||||||||||
| 10 | 15 | 42.4 | 24.5 | 15 | 44.5 | 4 | 42.6 | 9 | 33.3 | 15 | 42.7 | 4 | 45.9 |
| 9 | 3 | 35.1 | 26.6 | 3 | 42.4 | 11 | 33.6 | 4 | 30.7 | 3 | 37.1 | 9 | 36.9 |
| 8 | 9 | 32.1 | 23.2 | 6 | 35.8 | 9 | 33.5 | 6 | 30.2 | 6 | 33.9 | 3 | 36.9 |
| 7 | 6 | 32.0 | 23.3 | 9 | 34.0 | 6 | 32.7 | 44 | 27.9 | 11 | 33.1 | 6 | 35.8 |
| 6 | 11 | 31.2 | 23.7 | 11 | 29.0 | 23 | 32.5 | 11 | 24.5 | 9 | 32.6 | 11 | 35.7 |
| 5 | 23 | 31.2 | 25.6 | 22 | 28.4 | 3 | 31.6 | 3 | 23.4 | 23 | 31.1 | 22 | 35.6 |
| 4 | 22 | 29.9 | 25.0 | 23 | 24.1 | 22 | 29.1 | 23 | 23.3 | 22 | 29.2 | 23 | 33.8 |
| 3 | 44 | 23.8 | 20.9 | 44 | 20.9 | 44 | 27.4 | 19 | 21.6 | 44 | 26.3 | 24 | 24.6 |
| 2 | 24 | 22.3 | 25.6 | 19 | 17.6 | 19 | 23.1 | 22 | 18.3 | 19 | 21.4 | 19 | 23.8 |
| 1 | 19 | 21.5 | 22.2 | 24 | 13.1 | 24 | 22.1 | 24 | 13.7 | 24 | 20.3 | 44 | 21.1 |
Stay updated, free dental videos. Join our Telegram channel
VIDEdental - Online dental courses


