Introduction
Orthodontists rely heavily on soft-tissue analysis to determine facial esthetics and treatment stability. The aim of this retrospective study was to determine the equivalence of soft-tissue measurements between the 3dMD imaging system (3dMD, Atlanta, Ga) and the segmented skin surface images derived from cone-beam computed tomography.
Methods
Seventy preexisting 3dMD facial photographs and cone-beam computed tomography scans taken within minutes of each other for the same subjects were registered in 3 dimensions and superimposed using Vultus (3dMD) software. After reliability studies, 28 soft-tissue measurements were recorded with both imaging modalities and compared to analyze their equivalence. Intraclass correlation coefficients and Bland-Altman plots were used to assess interexaminer and intraexaminer repeatability and agreement. Summary statistics were calculated for all measurements. To demonstrate equivalence of the 2 methods, the difference needed a 95% confidence interval contained entirely within the equivalence limits defined by the repeatability results.
Results
Statistically significant differences were reported for the vermilion height, mouth width, total facial width, mouth symmetry, soft-tissue lip thickness, and eye symmetry.
Conclusions
There are areas of nonequivalence between the 2 imaging methods; however, the differences are clinically acceptable from the orthodontic point of view.
The relationship between symmetry and attractiveness of the face is well documented. Farkas noted the importance of paired and angular measurements in detecting asymmetries as well as quantifying the face. In clinical practice, disharmonies, even if belonging to the borderline values of the normal range statistically, might create visually the impression of moderate disproportions.
Objective evaluation of the soft tissues of the face is integral to effective treatment planning, postoperative assessment, and describing patterns of craniofacial growth and variation. The bony and dental framework supports the soft tissues of the face, which provides subtle and sometimes glaring information concerning the positioning of the framework. In the face, asymmetry can be produced either by defects of the underlying skeleton that can disrupt identification of the bony landmarks along the facial framework and midaxis of the face, or by disfigurements in the soft-tissue structures affecting the location of the soft-tissue landmarks.
Facial analysis has rapidly become the determinant of many orthodontic treatment choices. Although there are many limitations to what clinicians can do to change the soft tissues with orthodontic treatment, the soft tissues ultimately direct the treatment decisions. Assessing the intricate details of a patient’s facial anatomy in 3 dimensions has traditionally been limited to evaluating the patient clinically. New technology has been introduced to evaluate the patient’s 3-dimensional (3D) anatomic relationships. These advances in imaging have substantially enhanced the clinician’s diagnostic ability and, at the same time, obviated the need for exposing patients to extra ionizing radiation in many cases.
The aims of this study were to investigate the equivalence of soft-tissue data from 3dMD photographic imaging compared with that produced via soft-tissue segmentation from 3D CBCT images and to determine whether both methods can be used interchangeably and accurately for orthodontic esthetic treatment planning.
Material and methods
This retrospective study was performed with 70 3dMD images and 70 CBCT scans for the same subjects. The 70 participants consisted of 15 women with a mean age of 22.0 ± 2.3 years and 55 men with a mean age of 22.9 ± 4.1 years. They were a convenience sample of trumpet players who consented to participate in a prior study completed by the Department of Orthodontics at the School of Dentistry of Indiana University.
The 3dMD system was used to capture each subject’s 3D facial images. All subjects were positioned equidistant from each camera, which was set with a 1.5-ms capture speed. The i-CAT device (Imaging Sciences International, Hatfield, Pa), used for all CBCT scans, was set with a 13-cm field of view, 8.9-second scanning time, and 0.3 voxel scanning resolution. The images were taken within 30 minutes apart to minimize soft-tissue changes. All images were stored on secure computers in the Craniofacial Complex Center at the School of Dentistry of Indiana University.
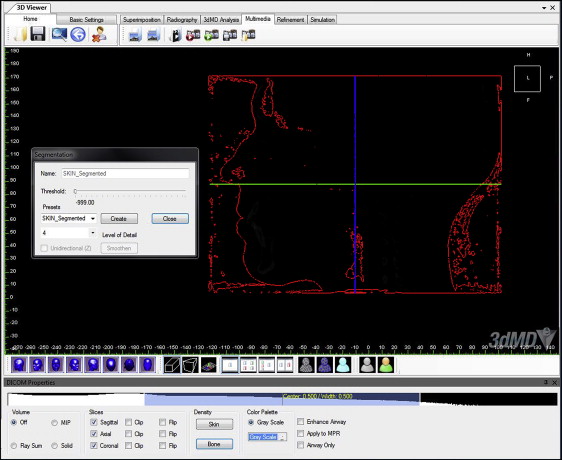
The parameters were selected based on previous studies of soft-tissue landmarks ( Table I ). The 3dMD photographic images and the segmented soft-tissue 3D CBCT images were coded and randomized to blind the investigator (T.E.M.) who was making the measurements. The images were registered, superimposed, and analyzed using Vultus software (3dMD). For each subject, a soft-tissue segmented view of the CBCT data was created by adjusting the threshold and Hounsfield units to the closest soft-tissue segmentation amount ( Fig 1 ). This process was done on all images in the same way and by the same investigator. The Hounsfield units value was preset at −999.0 in the 3dMD software for skin segmentation and was then adjusted if the segmentation was unsatisfactory.
| Parameter | Definition |
|---|---|
| Total facial height: N-Pg (mm) | Vertical linear measurement of facial dimension as measured from nasion (N) to pogonion (Pg) |
| Upper facial height: N-Sn (mm) | Vertical linear measurement of upper facial dimension as measured from nasion (N) to subnasale (Sn) |
| Lower facial height: Sn-Pg (mm) | Vertical linear measurement of lower facial dimension as measured from subnasale (Sn) to pogonion (Pg) |
| Vermilion height: LS-LI (mm) | Vertical linear measurement of lips from most prominent point of upper lip or labrale superior (LS) to most prominent point of lower lip or labrale inferior (LI) |
| Mouth width: Ch(R)-Ch(L) (mm) | Transverse linear measurement of mouth width from cheilion right Ch(R) to cheilion left Ch(L) |
| Total facial width: Tr(R)-Tr(L) (mm) | Transverse linear measurement of facial width as measured from tragion right Tr(R) to tragion left Tr(L) |
| Upper lip to E-line: LS to E-line (mm) | Anteroposterior linear position of upper lip (LS) to plane extending from tip of nose to most prominent point of chin (E-line) |
| Lower lip to E-line: LI to E-line (mm) | Anteroposterior linear position of lower lip (LI) to plane extending from tip of nose to most prominent point of chin (E-line) |
| Mandibular position vertically: Point B to axial plane (mm) | Vertical linear position of the deepest midline concavity on the mandibular symphysis (Point B) to the axial plane |
| Maxillary position vertically: Point A to axial plane (mm) | Vertical linear position of the deepest midline concavity on the maxilla (Point A) |
| Mandibular position AP: Point B to coronal plane (mm) | Anteroposterior (AP) linear position of the deepest midline concavity on the mndibular symphysis (Point B) |
| Maxillary position AP: Point A to coronal plane (mm) | Anteroposterior (AP) linear position of the deepest midline concavity on the maxilla (Point A) |
| Mouth symmetry: Ch(R) and Ch(L) to midsagittal plane (mm) Ch(R) and Ch(L) to axial plane (mm) |
Transverse and vertical linear comparison of cheilion right Ch(R) and cheilion left Ch(L) positions |
| Soft-tissue lip thickness: LS to maxillary central incisor (mm) LI to mandibular central incisor (mm) |
AP linear measurement of most prominent point of upper lip (LS) to maxillary central incisor and lower lip (LI) to mandibular central incisor |
| Eye symmetry: Exoc(R) and Exoc(L) to midsagittal plane (mm) Exoc(R) and Exoc(L) to axial plane (mm) |
Transverse and vertical linear comparison of exocanthion right (Exoc[R]) and exocanthion left (Exoc[L]) positions |
| Mandible symmetry: Go(R) and Go(L) to midsagittal plane (mm) Go(R) and Go(L) to axial plane (mm) |
Transverse and vertical linear comparison of gonion right (Go[R]) and gonion left (Go[L]) positions |
| Facial angle: N-Pn-Pg (°) | Angular measurement of soft-tissue profile measured from nasion (N) to pronasale (Pn) to pogonion (Pg) |
| Nasofacial angle: Pn-Sn-Pg (°) | Angular measurement of soft-tissue profile measured from pronasale (Pn) to subnasale (Sn) to pogonion (Pg) |
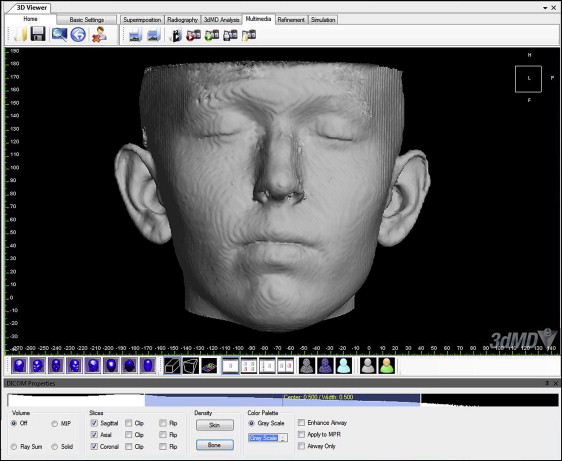
The skin segmentation view was further refined by choosing the initial refinement tool that is integrated in the software to remove the noise and excess areas that were not used in measurements ( Fig 2 ). Using the reference plane tool, hard-tissue reference planes were established first on each CBCT image showing the underlying skeletal structures. The midsagittal plane ran through nasion-anterior nasal spine-basion, the coronal plane passed through the most posterior and superior point of the condylar head, and the axial plane passed through porion and orbitale (Frankfort horizontal plane).
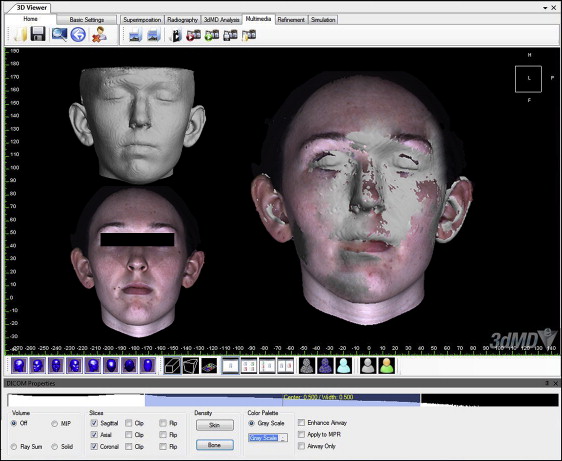
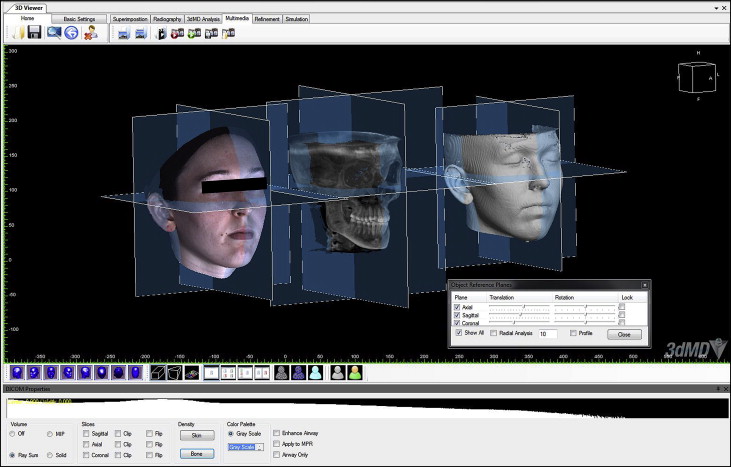
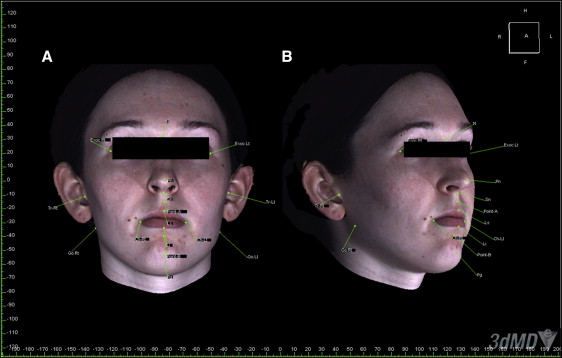
To standardize the position of each set of images, the segmented soft-tissue surface and the 3dMD photographic image were then superimposed by moving the 3dMD image manually onto the screen to coincide with the segmented soft-tissue surface of the CBCT image. The translucency of the 3dMD photograph was decreased to visualize the segmented soft-tissue surface data through the 3dMD data ( Fig 3 ). This process was performed from 3 planes (sagittal, coronal, and axial) to obtain the most accurate manual alignment between the images. The hard-tissue reference planes were matched on the soft-tissue CBCT image and the 3dMD photographic image and locked in position ( Fig 4 ). Landmarks were identified, and parameters were measured on each CBCT and 3dMD image separately using software measurement tools such as landmarking (soft-tissue landmarks) and calipers (distance and angular measurements) ( Fig 5 ).
Reliability was assessed by measuring the selected parameters of 10 randomly selected subjects. After registration and superimposition of the CBCT and 3dMD photographic images, the landmarks and the linear and angular parameters were identified on both the 3dMD images and the segmented soft-tissue surfaces of the CBCT images. All parameters were measured again by the same investigator 2 weeks later using the same workstation. The images were coded and randomized, and the primary investigator (T.E.M.) was blinded to the identity of the subjects. Measurements on the previous 10 subjects were repeated by a second investigator (A.A.G.) and compared for validity.
Statistical analysis
The images in the reliability study were analyzed using intraclass correlation coefficients and Bland-Altman plots to assess intraexaminer repeatability and interexaminer agreement. Summary statistics (means, standard deviations, standard errors, and ranges) were calculated for all measurements from both the 3dMD photographs and the CBCT images. The differences between the measurements and the ratio of the measurements for the 2 methods were calculated and summarized. To demonstrate the equivalence of the 2 methods, the difference between them must have a 95% confidence interval (CI) contained entirely within the equivalence limits defined for each measurement. The equivalence limits were defined based on the repeatability results for each measurement. With a sample size of 70 subjects, the study was designed to have 90% power to detect equivalence, using an equivalence range of ±0.4 SD, assuming that the true difference between the methods was zero, and a 2-sided 5% significance level. The results were determined to be clinically acceptable at an arbitrary value of 3 mm since interobserver error was less than 3 mm.
Results
The reliability subjects were analyzed using intraclass correlation coefficients and Bland-Altman plots to assess intraexaminer repeatability and interexaminer agreement. Intrarater reliability was high for all values, whereas some measurements had lower interrater reliability values (lower facial height, vermilion height, maxillary position in the anteroposterior direction, eye symmetry to the midsagittal plane, and mandibular symmetry to the midsagittal plane).
Although 70 3dMD and CBCT images were used in this study, not all 28 data points were identifiable for all subjects. Twenty-one of the 28 landmarks were measured on all 3dMD images, and 14 of the 28 landmarks were measured on all CBCT images. Summary statistics for all collected measurements were calculated for both the CBCT images and the 3dMD photographs ( Table II ). Statistically significant differences were reported for the following measurements: vermilion height, mouth width, total facial width, mouth symmetry to axial plane), soft-tissue lip thickness, and eye symmetry ( Table III ). All other data points were equivalent based on the mean differences between the 2 methods. Only 2 measurements (eye measures) barely exceeded the arbitrarily selected standard of 3 mm of asymmetry.
| Measurement | Method | Mean | SD | Minimum | Maximum |
|---|---|---|---|---|---|
| Total facial height: N-Pg (mm) | 3dMD | 114.6 | 8.7 | 94.7 | 132.9 |
| CBCT | 113.9 | 8.6 | 95.5 | 129.6 | |
| Upper facial height: N-Sn (mm) | 3dMD | 53.7 | 4.4 | 45.8 | 70.8 |
| CBCT | 54.2 | 4.5 | 44.6 | 73.6 | |
| Lower facial height: Sn-Pg (mm) | 3dMD | 62.1 | 7.4 | 44.4 | 77.4 |
| CBCT | 61.1 | 7.5 | 43.2 | 76.0 | |
| Vermilion height: LS-LI (mm) | 3dMD | 15.5 | 3.0 | 9.0 | 24.2 |
| CBCT | 16.2 | 2.7 | 11.2 | 24.2 | |
| Mouth width: Ch(R)-Ch(L) (mm) | 3dMD | 50.0 | 3.9 | 37.0 | 57.1 |
| CBCT | 47.8 | 5.3 | 36.0 | 63.8 | |
| Total facial width: Tr(R)-Tr(L) (mm) | 3dMD | 145.0 | 7.9 | 128.9 | 164.2 |
| CBCT | 146.9 | 7.8 | 131.2 | 165.1 | |
| Upper lip to E-line: LS to E-line (mm) | 3dMD | 5.5 | 2.7 | −2.7 | 11.2 |
| CBCT | 6.0 | 2.7 | −2.0 | 12.3 | |
| Lower lip to E-line: LI to E-line (mm) | 3dMD | 3.9 | 2.9 | −2.9 | 10.0 |
| CBCT | 4.2 | 2.8 | −3.0 | 9.2 | |
| Mandibular position vertically: Point B to axial plane (mm) | 3dMD | 64.2 | 4.9 | 54.9 | 76.1 |
| CBCT | 63.7 | 5.0 | 53.2 | 76.0 | |
| Maxillary position vertically: Point A to axial plane (mm) | 3dMD | 29.6 | 3.7 | 22.2 | 36.8 |
| CBCT | 29.9 | 3.9 | 22.0 | 39.3 | |
| Mandibular position AP: Point B to coronal line (mm) | 3dMD | 98.5 | 6.7 | 84.0 | 118.4 |
| CBCT | 97.9 | 6.4 | 82.4 | 117.4 | |
| Maxillary position AP: Point A to coronal line (mm) | 3dMD | 102.1 | 5.4 | 90.5 | 112.9 |
| CBCT | 101.1 | 5.4 | 89.7 | 111.9 | |
| Mouth symmetry: Ch(R) to midsagittal plane (mm) | 3dMD | 25.0 | 2.5 | 20.0 | 30.7 |
| CBCT | 24.0 | 3.0 | 17.7 | 36.6 | |
| Mouth symmetry: Ch(L) to midsagittal plane (mm) | 3dMD | 24.5 | 2.3 | 16.3 | 29.9 |
| CBCT | 22.7 | 2.7 | 16.3 | 29.9 | |
| Mouth symmetry: Ch(R) to axial plane (mm) | 3dMD | 49.4 | 3.4 | 43.2 | 58.8 |
| CBCT | 48.3 | 3.6 | 39.1 | 57.2 | |
| Mouth symmetry: Ch(L) to axial plane (mm) | 3dMD | 48.9 | 3.5 | 41.3 | 56.9 |
| CBCT | 47.9 | 3.5 | 39.2 | 55.5 | |
| Soft-tissue lip thickness: LS to maxillary central incisor (mm) | 3dMD | 30.4 | 5.6 | 18.6 | 53.9 |
| CBCT | 28.7 | 5.6 | 17.1 | 52.4 | |
| Soft-tissue lip thickness: LI to mandibular central incisor (mm) | 3dMD | 30.2 | 6.6 | 18.6 | 49.7 |
| CBCT | 27.9 | 5.8 | 16.9 | 45.9 | |
| Eye symmetry: Exoc(R) to axial plane (mm) | 3dMD | 16.9 | 2.1 | 12.0 | 21.5 |
| CBCT | 13.8 | 1.9 | 9.8 | 18.1 | |
| Eye symmetry: Exoc(L) to axial plane (mm) | 3dMD | 17.2 | 2.4 | 11.3 | 21.5 |
| CBCT | 14.1 | 1.9 | 9.6 | 18.3 | |
| Eye symmetry: Exoc(R) to midsagittal plane (mm) | 3dMD | 46.2 | 2.4 | 40.9 | 52.1 |
| CBCT | 45.6 | 3.0 | 39.1 | 53.7 | |
| Eye symmetry: Exoc(L) to midsagittal plane (mm) | 3dMD | 44.7 | 2.7 | 39.1 | 52.8 |
| CBCT | 43.7 | 3.0 | 37.0 | 50.6 | |
| Mandible symmetry: Go(R) to axial plane (mm) | 3dMD | 68.8 | 5.6 | 51.9 | 82.3 |
| CBCT | 68.8 | 5.7 | 50.3 | 82.2 | |
| Mandible symmetry: Go(L) to axial plane (mm) | 3dMD | 68.5 | 5.8 | 48.2 | 79.2 |
| CBCT | 68.6 | 5.7 | 48.5 | 78.7 | |
| Mandible symmetry: Go(R) to midsagittal plane (mm) | 3dMD | 60.7 | 7.0 | 51.5 | 82.6 |
| CBCT | 59.7 | 6.4 | 51.9 | 80.8 | |
| Mandible symmetry: Go(L) to midsagittal plane (mm) | 3dMD | 59.3 | 6.6 | 50.2 | 79.8 |
| CBCT | 59.0 | 6.8 | 48.9 | 81.3 | |
| Facial angle: N-Pn-Pg (°) | 3dMD | 129.3 | 4.9 | 115.4 | 140.6 |
| CBCT | 129.2 | 4.7 | 115.3 | 140.4 | |
| Nasofacial angle: Pn-Sn-Pg (°) | 3dMD | 138.9 | 7.4 | 121.8 | 160.1 |
| CBCT | 137.9 | 7.3 | 121.1 | 156.6 |
Stay updated, free dental videos. Join our Telegram channel
VIDEdental - Online dental courses


