Introduction
The purpose of this investigation was to examine the effect of Tweed edgewise treatment on the expression of mandibular growth in the horizontal direction through maintenance of vertical control.
Methods
We studied 36 patients who had 4 premolars extracted during treatment. Pretreatment, posttreatment, and postretention records of these patients were matched by age (± 6 months), sex, malocclusion, and treatment interval (± 6 months) to untreated controls from the Bolton-Brush Growth Study Center, Cleveland, Ohio. The cephalograms of the 2 samples were traced, digitized, and analyzed by descriptive cephalometric analysis and detailed regional superimposition.
Results
Tweed edgewise treatment can prevent clockwise rotation but was not observed to enhance the normal forward rotation of the mandible. The mandible did not rotate forward in the treated patients who underwent a greater chin advancement.
Conclusions
The pattern of skeletal change was favorable both during treatment and in later years. A feature of this effect was an improved pattern of mandibular growth displacement, when mandibular change was compared with maxillary change.
Malocclusion can occur, at least in part, as a result of an unfortunate pattern of facial growth. The translation and transformation of the components of the orofacial complex, however, cannot be attributed solely to genetics. Bone responds to its environment as it grows. This fact does not mean that growth can be modified in a controlled and predictable way.
Orthodontists seek treatment methods that can, in some measure, create an environment to ameliorate qualitative or quantitative growth deficiencies. Many orthodontists use a first phase of functional therapy, rather than rely solely on some form of fixed appliance treatment, largely because they assume that multibonded treatments can have no effect on growth. In contrast, some clinicians who use the Tweed-Merrifield edgewise technique have argued that their method of treatment controls the vertical dimension and thereby modifies the vector of mandibular growth, leading to counterclockwise mandibular rotation—an advancement of the chin at the expense of facial height. To this end, vertical-control mechanics are designed to inhibit an increase in anterior facial height by preventing molar extrusion. A goal of their treatment, therefore, is to control forward and downward maxillary growth to facilitate counterclockwise mandibular rotation. In 2 studies of the effects of orthodontic therapy on the vertical dimension, anterior facial height increased significantly during treatment. These findings disagree with a significant increase in the posterior facial height:anterior facial height ratio reported during treatment by other researchers. Similarly, vertical control has been studied in animals as well. Altuna and Woodside showed that molar intrusion resulted in a pattern of maxillary growth that featured minimal change in the vertical dimension, thereby leading to a more horizontal direction of mandibular growth in monkeys.
Clinical studies suggest that the amount or direction of mandibular growth can be altered by a variety of treatments, including, in the opinion of many, the edgewise appliance. The purpose of this investigation, a long-term comparison of 36 edgewise patients and untreated controls matched for age, sex, malocclusion, and treatment interval, was to examine the effect of a traditional edgewise treatment that attempts to increase the horizontal component of mandibular growth with techniques designed to control the vertical dimension.
Material and methods
In this study, we included 36 edgewise patients treated by a clinician (J.L.V.) who uses the Tweed directional force mechanics and 36 matched, untreated control subjects. The subjects were recruited as they returned for retention records. The criteria for inclusion in the study were that all subjects had pretreatment, posttreatment, and retention records, taken at average ages of 12.6 (range, 10.9-14.8 years), 14.8 (range, 12.4-16.11 years), and 23.4 (range, 18.1-26.8 years), respectively; Class I or Class II malocclusions; and the extraction of 4 premolars as part of their treatment. Patients treated without premolar extractions were not included in the sample. The treated group comprised 9 boys and 27 girls. Selection was unrelated to outcome, although a willingness to participate implies that the subjects were satisfied with their treatment. All patients were treated with a nontorqued, nonangulated, 0.022-in edgewise appliance. In this technique, the maxillary and mandibular arches were leveled and aligned, and after canine retraction had been completed in both arches, 0.019 × 0.025-in maxillary and mandibular closing-loop archwires were inserted. High-pull J-hook headgear force (recommended for approximately 10-12 hours per day) was applied to hooks soldered to the archwire between the maxillary central and lateral incisors. After mandibular space closure, mandibular anchorage usually was prepared, and the patients were instructed to wear the mandibular high-pull headgear against hooks soldered mesially to the canines on the mandibular archwire. A mandibular stabilizing archwire was then placed, and Class II elastics, anterior vertical elastics, and a high-pull headgear to the maxillary archwire were instituted. The intraoral elastics were supposed to be worn 24 hours a day during this treatment phase. Treatment averaged 26 months (range, 19-30 months).
Records from the untreated controls were obtained from the archives of the Bolton-Brush Growth Study Center, Case Western Reserve University, Cleveland, Ohio. A control subject was chosen to match each patient in the treated group with respect to age (±6 months), sex, malocclusion, and treatment interval (±6 months). Accordingly, there was a control group of 36 subjects against which to assess the effects of treatment.
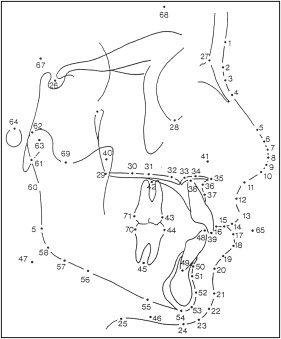
The pretreatment and posttreatment (T1 and T2) and postretention (T3) lateral cephalograms, as well as the cephalograms from the control subjects, were traced, superimposed, and digitized to examine the skeletal and dental effects of treatment. Adjustment was made for magnification differences between radiographs. The 3 films from each series were traced in pairs (T1 and T2; T2 and T3) so that outlines of the anatomic structures in the radiographs could be traced in a coordinated fashion and in sufficient detail to support a meaningful best-fit superimposition. Each tracing and superimposition was inspected by a second observer (L.E.J.). A digitizing regimen ( Fig 1 ) of 71 points was used to generate a descriptive cephalometric analysis composed of conventional angular and linear measures and ratios in each series (Dentofacial Planner, version 32; Dentofacial Software, Toronto, Ontario, Canada).
Regional “structural” superimpositions in the cranial base, maxilla, and mandible were used to measure the dental and skeletal components of the changes in molar relationship and overjet during and after treatment. In the structural method developed by Baumrind et al, an arbitrary “fiducial line” was drawn above the cranial base of the second tracing. After a best-fit superimposition on the stable structures described by the study of Björk and Skieller, this line was then carried through to the first and third tracings. Fiducial lines permit the analysis of basal translation and rotation. As with the cranial base superimposition, arbitrary fiducial lines were drawn above the maxilla and below the mandibular border of the second tracing and passed through to the first and third tracings based on stable trabecular details. These maxillary and mandibular fiducial lines were used to show the pattern of structural rotation of maxillary and mandibular basal bones relative to the cranial base. Surface deposition and resorption mask much of this rotation; accordingly, it is assumed that basal rotation will exceed that measured from surface landmarks.
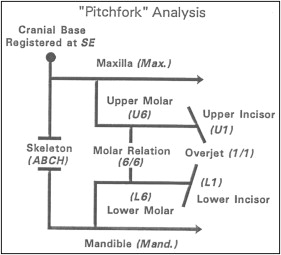
An aim of our analysis was to measure the anteroposterior skeletal and dental effects of growth and treatment. To this end, the pitchfork analysis was used to measure skeletal and dental changes parallel to the mean functional occlusal plane, here defined as the average of first and third functional occlusal planes with the maxillae superimposed. The functional occlusal plane is a best-fit line passing through the occlusal intercuspation of the first molars and first and second premolars. Anteroposterior skeletal and dental changes were then measured parallel to the mean functional occlusal plane based on regional superimpositions in the cranial base, maxilla, and mandible. “Apical base change” is the excess mandibular advancement relative to the maxilla. It is, therefore, a summary of the skeletal component of molar and overjet correction.
All skeletal and dental movements were given positive or negative signs according to their contribution to the anteroposterior correction. A positive sign indicated a contribution to the correction of a Class II relationship or a reduction in overjet, as with forward growth of the mandible or mesial movement of the mandibular teeth. A negative sign meant an effect that caused the Class II relationship or the overjet to become worse, as with forward maxillary growth or mesial movement of the maxillary teeth.
The most clearly visualized maxillary and mandibular first molars from any radiograph in the series were chosen and used to trace individual first molar and incisor templates. The dentition was traced with the aid of these standardized tracings. Dental movement was then measured parallel to the mean functional occlusal plane in each series. With a maxillary superimposition, maxillary tooth movement relative to maxillary basal bone was measured as the distance between the mesial contact points of the first molars and gave the total molar movement. Bodily molar movement was measured at the root apices: the movement of a point at which a line connecting the molar apices intersects the long axis of the tooth. A tipping component then can be resolved by subtracting bodily movement from crown movement.
Statistical analysis
Means and standard deviations were calculated for the descriptive cephalometric and regional superimposition measurements. Pitchfork diagrams also were used to depict schematically the skeletal and dental components of the molar and overjet corrections as estimated from the regional superimposition ( Fig 2 ).
The results of the multivariate analysis of the control or treatment differences showed that the 2 groups were significantly different ( F = 6.1; P <0.01) at T1 ( Tables I and II ). Because of this initial morphologic difference, subsequent analysis was directed toward an analysis of the increments of change between T1 and T2, T2 and T3, and overall, between T1 and T3. Such comparisons were assumed to be meaningful because the increments of change are generally unrelated to initial size and shape. The Hotelling T 2 was used to test the hypothesis that the pairwise control and treatment differences in the various increments of change are zero, both during and after treatment. With a significant T 2 , the source of the difference was then explored with individual paired t tests.
| Variable (°) | Groups | Paired t test | |||||
|---|---|---|---|---|---|---|---|
| Treated | Control | Difference | t | ||||
| Mean | SD | Mean | SD | Mean | SD | ||
| SNA | 82.4 | 3.0 | 86.0 | 3.0 | −3.4 | 4.2 | −5.1 † |
| SNB | 78.2 | 3.0 | 81.2 | 3.0 | −2.8 | 3.6 | −4.4 † |
| ANB | 4.2 | 2.4 | 4.7 | 2.4 | −0.4 | 3.0 | −0.8 |
| Upper 1 to SN | 106.9 | 8.4 | 105.9 | 8.4 | 0.9 | 9.0 | 0.6 |
| Lower 1 to NB | 25.3 | 6.0 | 26.4 | 6 | −1.0 | 8.4 | −0.7 |
| FMIA | 61.6 | 6.6 | 65.2 | 6.6 | −3.6 | 9.6 | −2.3* |
| IMPA | 94.3 | 7.2 | 97.3 | 7.2 | −2.9 | 9.6 | −1.9 |
| Interincisal | 126.1 | 10.2 | 133.0 | 10.2 | −6.9 | 13.2 | −3.2 † |
| FOP to SN | 17.6 | 4.2 | 16.0 | 3.6 | 1.7 | 4.8 | 2.2* |
| FOP to FH | 9.0 | 3.6 | 5.5 | 3.6 | 3.5 | 6.0 | 3.7 † |
| FMA | 24.1 | 4.8 | 21.6 | 4.8 | 2.7 | 6.6 | 2.5* |
| Upper Z | 74.6 | 6.0 | 79.7 | 6.0 | −4.9 | 9.0 | −3.3 † |
| Lower Z | 73.8 | 8.4 | 79.2 | 8.4 | −5.5 | 12.0 | −2.7 † |
| Structural rotation | |||||||
| Mandibular fiducial line | 46.0 | 7.8 | 42.2 | 7.8 | 3.7 | 10.2 | 2.2* |
| Maxillary fiducial line | 13.4 | 4.8 | 13.9 | 4.8 | −0.5 | 6.6 | −0.5 |
| Variable (mm) | Groups | Paired t test | |||||
|---|---|---|---|---|---|---|---|
| Treated | Control | Difference | t | ||||
| Mean | SD | Mean | SD | Mean | SD | ||
| Upper 1 to NA | 4.5 | 3.0 | 2.0 | 3.0 | 2.6 | 3.0 | 4.8 † |
| Lower 1 to NB | 4.8 | 2.4 | 4.4 | 2.4 | 0.4 | 2.4 | 1.0 |
| Wits appraisal | 0.7 | 3.6 | 1.8 | 3.6 | −1.1 | 4.2 | −1.5 |
| Lower 1 to A-Pog | 1.2 | 1.8 | 0.4 | 1.8 | 0.9 | 2.4 | 2.4* |
| Pog to NB | 1.7 | 1.8 | 1.9 | 1.8 | −0.1 | 1.8 | −0.4 |
| Co to A-point | 90.2 | 4.8 | 88.9 | 4.8 | 1.3 | 5.4 | 1.4 |
| A-point to N perpendicular | 1.1 | 3.6 | 4.3 | 4.8 | −3.2 | 5.4 | −3.5 † |
| Co to Gn | 115 | 5.4 | 112.5 | 5.4 | 2.5 | 6.0 | 2.5* |
| Ar to Gn | 106.3 | 5.4 | 104.6 | 5.4 | 1.7 | 6.0 | 1.7 |
| N to Me | 116.8 | 6.0 | 113.2 | 6.0 | 3.6 | 7.2 | 2.9 † |
| Lower lip to E-plane | −0.6 | 2.4 | −1.6 | 2.4 | 1.0 | 3.6 | 1.7 |
| Overjet along FOP | 6.0 | 2.4 | 4.3 | 2.4 | 1.8 | 3.0 | 3.3 † |
| Overbite along FOP | 2.9 | 1.8 | 3.5 | 1.8 | −0.5 | 2.4 | −1.2 |
| Molar class | 0.1 | 1.8 | 0.4 | 1.8 | −0.2 | 1.8 | −0.7 |
| Rotation surface measures | |||||||
| AFH | 66.4 | 5.4 | 63.5 | 5.4 | 2.9 | 7.2 | 2.5* |
| PFH | 61.7 | 4.2 | 62.4 | 4.2 | −0.7 | 5.4 | −0.8 |
Because 1 objective of this study was to compare the skeletal and dental components of molar and overjet corrections in the treated group and the untreated controls, paired t tests were used to test for significant between-groups differences in the skeletal and dental measurements from the regional superimpositions. Although the pitchfork diagram summarized how much of the correction was accomplished by growth or dental movement, the results of the paired t tests indicated whether these effects differed between the treated and control groups.
Records of 5 patients were randomly selected to be retraced, redigitized, and remeasured. Intraclass correlation was then used to characterize the reliability of the various cephalometric measurements.
Results
Means and standard deviations for the changes in various dimensions are summarized in Tables III and IV . As might be expected of a comparison between treated and untreated subjects, the pairwise control or treatment differences were highly statistically significant ( F = 84.5; P <0.01). Specifically, the mean increments of change for maxillary incisor to SN, mandibular incisor to NB, FMIA, IMPA, interincisal angle, upper and lower Z angles, maxillary incisor to NA (mm), mandibular incisor to NB (mm), mandibular incisor to A-Pog (mm), lower lip to E-plane, molar relationship, and overjet and overbite corrections showed significant between-groups differences. Changes in SNA, SNB, ANB, functional occlusal plane to Frankfort horizontal, Co to A-point, A-point to N perpendicular, N to Me, pogonion to NB, posterior face height, anterior face height, and both maxillary and mandibular rotations were also significantly different.
| Variable (°) | Groups | Paired t test | |||||
|---|---|---|---|---|---|---|---|
| Treated | Control | Difference | t | ||||
| Mean | SD | Mean | SD | Mean | SD | ||
| SNA | −1.9 | 1.8 | 0.4 | 1.8 | −2.3 | 2.4 | −6.0 † |
| SNB | −0.3 | 1.8 | 0.5 | 1.8 | −0.9 | 2.4 | −2.4* |
| ANB | −1.6 | 1.2 | 0.0 | 1.2 | −1.6 | 1.8 | −5.6 † |
| Upper 1 to SN | −4.6 | 6.6 | 0.2 | 6.6 | −4.8 | 8.4 | −3.3 † |
| Lower 1 to NB | −4.6 | 3.6 | −0.8 | 3.6 | −4.0 | 6.0 | −4.1 † |
| FMIA | 5.0 | 4.2 | 0.8 | 4.2 | 4.2 | 6.6 | 3.8 † |
| IMPA | −4.7 | 4.2 | −0.7 | 4.2 | −4.1 | 4.8 | −4.8 † |
| Interincisal | 9.0 | 62.4 | 0.9 | 8.4 | 8.1 | 10.2 | 4.7 † |
| FOP to SN | −1.7 | 3.0 | −1.0 | 3.0 | −0.7 | 3.6 | −1.1 |
| FOP to FH | −2.2 | 4.2 | −0.5 | 3.6 | −1.8 | 4.2 | −2.5* |
| FMA | −0.4 | 3.0 | −0.3 | 3.0 | −0.1 | 4.2 | −0.1 |
| Upper Z | 5.5 | 3.6 | −0.4 | 3.6 | 5.9 | 4.8 | 7.7 † |
| Lower Z | 6.9 | 4.8 | 0.5 | 4.8 | 6.5 | 6.0 | 6.5 † |
| Structural rotation | |||||||
| Mandibular fiducial line | −0.1 | 1.8 | −1.3 | 1.8 | 1.1 | 2.4 | 2.6* |
| Maxillary fiducial line | 1.6 | 1.8 | −0.2 | 1.8 | 1.7 | 2.4 | 4.6 † |
| Variable (mm) | Groups | Paired t -test | |||||
|---|---|---|---|---|---|---|---|
| Treated | Control | Difference | t | ||||
| Mean | SD | Mean | SD | Mean | SD | ||
| Upper 1 to NA | −2.0 | 1.8 | 0.0 | 2.4 | −2.1 | 3.0 | −4.7 † |
| Lower 1 to NB | −1.5 | 1.2 | −0.1 | 1.2 | −1.4 | 1.8 | −4.6 † |
| Wits appraisal | −0.4 | 2.4 | 0.3 | 2.4 | −0.5 | 3.0 | −0.9 |
| Lower 1 to A-Pog | −1.1 | 1.2 | −0.3 | 1.2 | 0.8 | 1.8 | −2.6* |
| Pog to NB | 1.8 | 1.2 | 0.5 | 1.2 | 1.2 | 1.2 | 5.5 † |
| Co to A-point | 1.2 | 3.0 | 3.7 | 3.0 | −2.6 | 4.2 | −3.8 † |
| A-point to N perpendicular | −1.4 | 2.4 | 0.4 | 2.4 | −1.8 | 3.0 | −3.6 † |
| Co to Gn | 6.8 | 4.2 | 5.2 | 4.2 | 1.6 | 4.8 | 2.0 |
| Ar to Gn | 6.9 | 4.2 | 5.2 | 4.2 | 1.7 | 5.4 | 1.9 |
| N to Me | 7.2 | 3.6 | 4.6 | 3.6 | 2.7 | 3.6 | 4.2 † |
| Lower lip to E-plane | −2.9 | 1.8 | −0.5 | 1.8 | −2.4 | 2.4 | −6.1 † |
| Overjet along FOP | −2.8 | 2.4 | 0.3 | 2.4 | −3.2 | 3.0 | −5.8 † |
| Overbite along FOP | −1.1 | 1.8 | 0.4 | 1.8 | −1.4 | 2.4 | −3.1 † |
| Molar class | 1.6 | 1.8 | −0.1 | 1.8 | 1.8 | 2.4 | −4.6 † |
| Rotation surface measures | |||||||
| AFH | 4.4 | 2.4 | 2.4 | 2.4 | 1.9 | 3.6 | 3.4 † |
| PFH | 5.6 | 3.6 | 3.9 | 3.6 | 1.7 | 3.6 | 2.7* |
| PFH:AFH ratio | 0.8 | 2.4 | 1.0 | 1.8 | −0.3 | 3.0 | −0.6 |
Descriptive statistics for posttreatment changes are summarized in Tables V and VI . A simultaneous comparison of the mean increments for the various cephalometric dimensions by the Hotelling T 2 showed significant between-groups differences ( F = 64.7; P <0.01). There were statistically significant differences in posttreatment changes for mandibular incisor to NB, FMIA, interincisal angle, upper and lower Z angles, maxillary incisor to NA (mm), mandibular incisor to NB (mm), Wits appraisal, Co to A-point, Ar to Gn, lower lip to E-plane, overjet, and overbite. In addition, mandibular length showed a significantly greater increase in the treated group.
| Variable (°) | Groups | Paired t test | |||||
|---|---|---|---|---|---|---|---|
| Treated | Control | Difference | t | ||||
| Mean | SD | Mean | SD | Mean | SD | ||
| SNA | 0.0 | 1.2 | 0.1 | 1.2 | −0.1 | 1.8 | −0.4 |
| SNB | 0.4 | 1.2 | 0.0 | 1.2 | 0.4 | 1.2 | 1.5 |
| ANB | −0.4 | 0.6 | 0.0 | 0.6 | 0.4 | 1.2 | −1.7 |
| Upper 1 to SN | −1.0 | 3.6 | −0.8 | 3.6 | −0.3 | 4.8 | −0.3 |
| Lower 1 to NB | −1.3 | 3.0 | 0.5 | 3.0 | −1.7 | 1.8 | −2.6* |
| FMIA | 1.7 | 3.0 | −0.6 | 3.0 | 2.3 | 4.2 | 3.1 † |
| IMPA | 0.0 | 3.6 | 1.2 | 3.6 | −1.2 | 4.2 | −1.6 |
| Interincisal | 2.7 | 4.8 | 0.1 | 4.8 | 2.6 | 7.2 | 2.2* |
| FOP to SN | −0.1 | 1.8 | −0.7 | 1.8 | 0.6 | 3.0 | 1.3 |
| FOP to FH | −0.1 | 2.4 | −0.6 | 3.0 | 0.4 | 3.0 | 0.9 |
| FMA | −1.6 | 2.4 | −0.9 | 2.4 | −0.8 | 3.0 | −1.6 |
| Upper Z | 3.2 | 3.0 | 1.1 | 3.0 | 1.9 | 4.2 | 2.8 † |
| Lower Z | 3.7 | 3.6 | 0.3 | 4.2 | 3.5 | 5.4 | 3.8 † |
| Structural rotation | |||||||
| Mandibular fiducial line | −0.8 | 1.8 | −0.8 | 1.8 | 0.1 | 2.4 | 0.2 |
| Maxillary fiducial line | 0.2 | 1.2 | 0.3 | 1.2 | −0.1 | 1.8 | −0.2 |
Stay updated, free dental videos. Join our Telegram channel
VIDEdental - Online dental courses


