Introduction
Determination of the maturation level and the subsequent evaluation of growth potential during preadolescence and adolescence are important for optimal orthodontic treatment planning and timing. This study was undertaken to evaluate the applicability of insulin-like growth factor I (IGF-I) blood level as a maturation indicator by correlating it to the cervical vertebral maturation index.
Methods
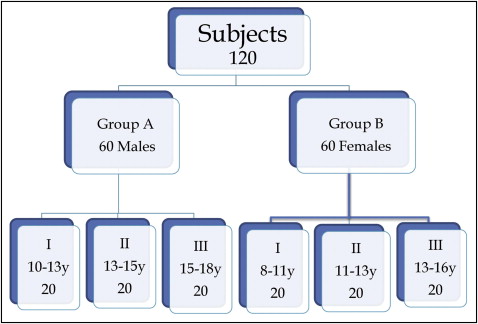
The study was conducted with 120 subjects, equally divided into 60 males (ages, 10-18 years) and 60 females (ages, 8-16 years). A lateral cephalometric radiograph and a blood sample were taken from each subject. For each subject, cervical vertebral maturation and IGF-I serum level were assessed. Mean values of IGF-I in each stage of cervical vertebral maturation were calculated, and the means in each stage were statistically compared with those of the other stages.
Results
The IGF-I mean value at each cervical vertebral maturation stage was statistically different from the mean values at the other stages. The highest mean values were observed in stage 4, followed by stage 5 in males and stage 3 in females.
Conclusions
IGF-I serum level is a reliable maturation indicator that could be applied in orthodontic diagnosis.
The timing and the amount of remaining facial growth are important factors that play major roles in treatment planning and retention in orthodontics and dentofacial orthopedics. Hence, the determination of biologic maturation level and the subsequent evaluation of growth potential during preadolescence and adolescence are extremely important.
Chronologic age, dental development, body weight, height, menarche, and voice and breast changes have been shown to be unreliable and impractical for estimating the pubertal growth spurt.
Skeletal age assessments with hand-wrist and lateral cephalometric radiographs have been shown to be correlated with skeletal growth changes during puberty. The hand-wrist maturation indicator is classically the most reliable skeletal maturation indicator. The use of the cervical vertebral maturation indicator has the advantage of not requiring an additional radiograph. Studies of the cervical vertebral maturation stages have shown correlations with the hand-wrist stages of maturation, thus providing a practical means for estimating facial and mandibular growth. The original method, proposed by Lamparski, incorporates vertebrae that might be obscured by the thyroid collar. The method of Hassel and Farman uses the second through the fourth vertebrae to avoid the defect in the original method. The 5-stage method of Baccetti et al merges the first 2 stages. The 6-stage method of Baccetti et al also uses the second through the fourth vertebrae; however, it was reported to have poor reproducibility and predictability.
Insulin-like growth factor I (IGF-I) is a polypeptide hormone synthesized mainly by the liver. It is a member of a group of hormones termed insulin-like growth factors. It is considered a mediator of growth-hormone function. It is involved in the growth of almost every organ and plays a major role in postnatal growth and precisely in the process of longitudinal bone growth. Salmon and Daughaday were the first to discover IGF-I as a mediator of growth-hormone function, which was termed the sulphation factor. Several studies conducted on IGF-I have reported that its serum levels in children and adolescents followed a pattern that was closely related to the pubertal growth curve: low in the prepubertal stages followed by a sharp increase at puberty and, after pubertal growth had ceased, returning to lower baseline values.
In a sample of 807 healthy Turkish children, age-related and sex-related reference ranges for serum IGF-I levels were established. Peak IGF-I concentrations were reached 1 year earlier and in 1 pubertal stage earlier in girls than boys, and they started to decline thereafter. Reference values in a group of Chinese adolescents for serum levels of IGF-I have been established; it was concluded that serum IGF-I levels peaked at typical pubertal ages (12-14 years in girls; 14-16 years in boys).
IGF-I blood levels have been proposed as an alternative method to detect pubertal growth-spurt timing. IGF-I blood levels have been correlated with the cervical vertebral maturation stages in a sample of 84 Saudis; it was concluded that IGF-I could be used as a skeletal maturity indicator and might be useful in detecting residual mandibular growth in young adults. IGF-I was also correlated with the hand-wrist skeletal maturation pattern, and it was concluded that mean IGF-I levels followed at various skeletal stages mirrored the mandibular growth velocity pattern that Fishman and Masoud et al observed.
The importance of growth determination in orthodontics is the driving force of the quest for the most accurate and least invasive methodology to track the pubertal growth spurt. The aim of this study was to evaluate IGF-I as a maturation indicator in correlation to cervical vertebral maturation in a group of circumpubertal adolescents.
Material and methods
One hundred twenty subjects were selected from the outpatient clinic at the Department of Orthodontics, Faculty of Oral and Dental Medicine, at Cairo University in Egypt. All subjects were either patients under active orthodontic treatment or new patients requiring orthodontic treatment at the clinic.
The age ranges were 10 to 18 years for male subjects and 8 to 16 years for female subjects. Exclusion criteria were systemic disease, bleeding disorders, chronic medication uptake, and trauma or operation in the area of the cervical vertebrae.
Subject selection for sample collection was organized by creating age subgroups for both male and female groups that would result in a uniformly distributed sample among the different stages of the cervical vertebral maturation. The distribution of various groups and subgroups is illustrated in Figure 1 .
Personal information and history were recorded for every subject to rule out the exclusion criteria. The parents and each subject were then informed about the research plan for approval of taking a blood sample and using a lateral cephalometric radiograph that was already available as part of the patient’s records file. Approval was obtained from the research ethical committee of the Faculty of Oral and Dental Medicine of Cairo University.
Blood samples were collected for analysis of IGF-I by venipuncture between 9:00 am and 11:00 am . The samples were transferred to the laboratory of the Clinical Pathology Department at the Faculty of Medicine of Cairo University. The samples were analyzed with the enzyme-linked immunosorbent assay (ELISA) technique. Once received in the laboratory, the samples were placed on a centrifuge for separation of plasma from blood cells. The plasma was then placed in plastic Eppendorf disposable centrifuge tubes (Eppendorf, Zhijiang, China) and stored in a freezer at –20°C according to the instructions of the blood analysis kit manufacturer (DIAsource ImmunoAssays, Nivelles, Belgium). A pretreatment step was introduced to enhance the clinical performance of the assay with the acid-ethanol procedure of Daughaday et al. A fixed amount of IGF-I was labeled with horseradish peroxidase, compete with unlabelled IGF-I in the calibrators, controls, and samples for a limited number of binding sites on a specific antibody. After a 1-hour incubation at room temperature, the microtiter plate was washed to stop the competition reaction. The chromogenic solution (tertamethylbenzydine) was then added and incubated for 30 minutes. The reaction was stopped with the addition of a stop solution, and the microtiter plates were read at the appropriate wavelength. The amount of substrate turnover was determined colorimetrically by measuring the absorbance, which is inversely proportional to the IGF-I concentration. A calibration curve was plotted, and the IGF-I concentration in the samples was determined by interpolation from the calibration curve.
Subjects were referred to obtain a digital lateral cephalometric radiograph on the same day as the blood sample was taken. All subjects were oriented in natural head position. All lateral cephalometric radiographs were taken by the same operator on the same machine.
Upon retrieval of the radiographic films, the area of the cervical vertebrae was traced on matte acetate paper by 1 examiner (R.I.). The superior, inferior, posterior, and anterior borders of the second, third, and fourth cervical vertebrae were traced. We used a standardized stepwise technique to facilitate the assessment of the cervical vertebral maturation index stages.
- 1.
Point identification and line construction: a schematic representation of the traced vertebrae showing the points identified and the lines constructed; the description of each is presented in Figure 2 .
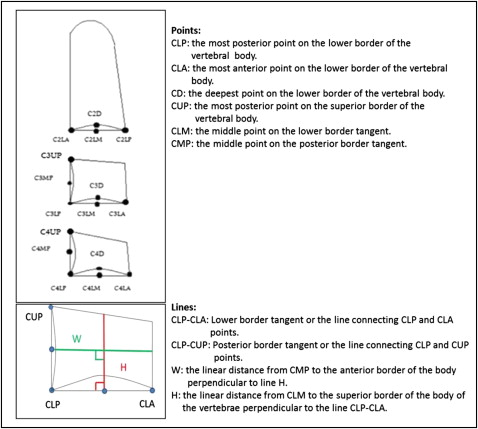
Fig 2 Diagram showing the various points and lines used in the cephalometric analysis of the cervical vertebrae. - 2.
Cephalometric measurements included the following. Measurement of concavity depth at the inferior border of the vertebral body: the linear distance between point CD and the line connecting points CLP and CLA (see Fig 2 for definitions) dictates the presence and extent of concavity at the inferior border of the body of the vertebrae as described in Table I . Measurements for assessment of the shape of the body of the cervical vertebrae: the ratio of line W to line H indicated the shape of the vertebral body as described in Table I . All measurements were repeated by 2 other examiners on 2 different occasions.
Table ICharacteristics of the various stages of the cervical vertebral maturation index and the values of eachCriteria Description Value Vertebral body shape Wedge shaped <65% Horizontally rectangular 65-80% Almost square 80-95% Square 95-105% Vertically rectangular >105% Concavity depth Flat 0 mm Beginning <1 mm Distinct 1-2 mm Accentuated 2-3 mm Deep >3 mm - 3.
The cervical vertebral maturation index was then evaluated according to the method described by Hassel and Farman. It describes the 6 cervical maturation stages according to the morphologic characteristics of the second, third, and fourth vertebrae ( Fig 3 ).
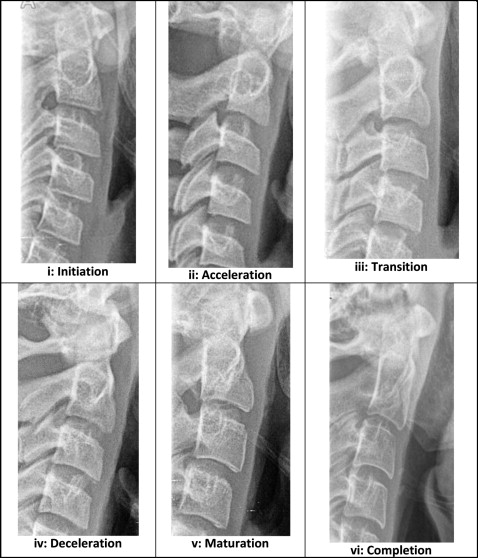
Fig 3 The 6 stages of cervical vertebral maturation according to the method of Hassel and Farman cropped from lateral cephalometric radiographs of the subjects.
Statistical analysis
Statistical analysis was performed with SPSS for Windows software (version 16.0; SPSS, Chicago, Ill). The significance level was set at P ≤0.05. The Kruskal-Wallis test was used to compare the mean IGF-I values in the different cervical vertebral maturation stages. The Mann-Whitney U test was used to compare the mean IGF-I values between the sexes in each cervical vertebral maturation stage. Interexaminer reliability in identifying cephalometric landmarks was evaluated by using the Cronbach alpha reliability coefficient.
Results
Table II and Figure 4 present mean and standard deviation values of IGF-I for each stage of the cervical vertebral maturation index in the male group, the female group, and the whole sample. Mean IGF-I serum level increased gradually from its lowest value at stage 1 toward stage 2. A sharper increase was observed between stages 2 and 3, and the peak value was reached at stage 4. It then declined toward stage 5 to reach its baseline level at stage 6 ( Fig 5 ). Mean IGF-I values recorded at each stage of the cervical vertebral maturation index were statistically different from the values recorded at the other stages.
| Stage | IGF-I | P value | |||||||||||
|---|---|---|---|---|---|---|---|---|---|---|---|---|---|
| Whole sample | Males | females | |||||||||||
| n | Mean age (y) | Mean value (ng/mL) | SD | n | Mean age (y) | Mean value (ng/mL) | SD | n | Mean age (y) | Mean value (ng/mL) | SD | ||
| Stage 1 | 22 | 10.3 | 209.3 f | 61 | 10 | 11 | 187 f | 30 | 12 | 9.8 | 227 e | 74 | <0.001 * |
| Stage 2 | 23 | 11.7 | 298.6 d | 85 | 13 | 12.2 | 309 d | 93 | 10 | 11.2 | 284 d | 75 | <0.001 * |
| Stage 3 | 19 | 13.1 | 519.7 c | 175 | 10 | 13 | 463 c | 164 | 9 | 13.1 | 582 b | 175 | <0.001 * |
| Stage 4 | 24 | 14 | 835.6 a | 201 | 10 | 14.5 | 893 a | 171 | 14 | 13.7 | 794 a | 217 | <0.001 * |
| Stage 5 | 15 | 15.3 | 617.3 b | 175 | 8 | 15.6 | 681 b | 122 | 7 | 14.9 | 544 c | 207 | <0.001 * |
| Stage 6 | 17 | 16.6 | 253.5 e | 111 | 9 | 17.3 | 230 e | 119 | 8 | 15.8 | 279 d | 104 | <0.001 * |
Stay updated, free dental videos. Join our Telegram channel
VIDEdental - Online dental courses


