Introduction
Root resorption can cause damage in orthodontic patients. Digital subtraction radiography (DSR) is a useful resource for the detection of mineral losses. The purpose of this study was to compare the efficacy of digital radiography (DR) and DSR in detecting simulated external root resorption. Examiner agreement between the 2 techniques was also evaluated.
Methods
Root resorptions of various sizes were simulated on the apical and lingual aspects of 49 teeth from 9 dry human mandibles. The teeth were radiographed in standardized conditions. The radiographs were registered with Regeemy Image Registration and Mosaicking (version 0.2.43-RCB, DPI-INPE, São José dos Campos, São Paulo, Brazil) and subtracted with Image Tool (University of Texas Health Science Center at San Antonio). The subtracted images and the digital radiographs were evaluated by 3 oral radiologists.
Results
No statistically significant differences were found for the methods in the detection of apical root resorptions, independently from lesion size, and of lingual resorptions of 1.2 mm or greater. DSR was significantly better than DR for detection of lingual resorptions up to 1 mm. Resorptions less than 0.5 mm were not precisely detected by either method. DSR provided better intraexaminer and interexaminer agreement than did DR.
Conclusions
Both methods are precise for detection of apical root resorptions as small as 0.5 mm and lingual resorptions of 1 mm or more. However, DSR frequently performed better than did DR.
Although most root resorptions due to orthodontic treatment are not greater than 1 mm and do not impair tooth function, about 8% of patients will have root resorptions greater than 3 mm after 12 months of treatment, with a chance of larger resorptions that can endanger the stability of the occlusion.
Because root resorption is usually asymptomatic, the only means to clinically detect and measure its severity is with radiographic images. Periapical radiography is the most common technique for the assessment of these lesions. However, the image projection on periapical radiographs is influenced by a number of factors, such as magnification errors, angular variations between the teeth and the film, difficulties in the identification of the same reference points in 2 subsequent radiographs, differences between image development, and different operators obtaining subsequent radiographs. Patient-related variables such as localization of the lesion and position of the teeth on the alveolar bone also influence the diagnostic process of root resorption. Furthermore, the quantification of resorption is impossible, even by using serial images because the development of resorption is slow, although studies that calculate the amount of root resorption often ignore these inherent errors.
The examiner’s influence also must be considered in radiographic interpretation. Studies have demonstrated lack of agreement over consecutive readings among examiners as well as reading discrepancies of the same examiner during radiographic interpretation. Consequently, false-positive and false-negative results will increase, reflecting the instruction, training, and experience of the examiner. Subtle mineral losses usually not detected on radiographic images are another cause of difficulty in image interpretation because only greater amounts of loss (30%-60%) can be visually detected on radiographs.
Levander et al stated that the diagnosis of root resorption with plain radiographs is uncertain during the first months of treatment. Only after 5 to 6 months is it possible to make a reliable diagnosis. Resorption on the lingual or proximal aspect of the roots is even more difficult to detect because of the superimposition of surrounding structures (so-called anatomic or structural noise), unless the lesion is extensive. Andreasen et al observed a remarkable discrepancy between the radiographic and histologic conditions of external root resorptions. Therefore, therapeutic procedures begun when the radiographic diagnosis of the resorptions is made could lead to complications such as root perforation in some cases.
Many methods for evaluation of root resorption are described in literature. Most methods try to make a precise quantification of the resorption, whereas others are only qualitative.
The method of assessment, the sample, and the examiners are factors that influence the results and do not allow definitive conclusions about the incidence and extensiveness of external root resorptions. Reports on the prevalence of root resorption after orthodontic treatment are not precise because it is difficult to visualize the resorptions in all aspects of the roots with the usual radiographic techniques.
On the other hand, digital subtraction radiography (DSR) is useful for detection of small dental and bony losses because it reduces the structural noise by suppressing identical features in subsequent radiographs. Structural noise limits the operator’s ability to visually analyze conventional radiographs, since it results from the superimposition of unaltered anatomic structures represented by complex radiographic patterns that can conceal the pathologic process.
With DSR, alterations of mineral quantity are shown over a neutral gray background. Hence, the sensitivity of DSR in the diagnosis and assessment of pathologic processes is greater than that of conventional radiographs. Studies have demonstrated that DSR is 90% more precise in detecting mineral losses as small as 5%.
Due to the damage that severe root resorption can cause and because DSR is a useful resource for the detection of mineral gains and losses, the purpose of this study was to compare geometrically reconstructed digital radiography (DR) with DSR in the diagnosis of simulated lingual and apical root resorptions. Our aims were to contribute to the clinical control of root resorption and to provide a more precise and reproducible method to assess resorption, since its early diagnosis allows preventive and therapeutic procedures for tooth movement.
Material and methods
The sample comprised 49 teeth from 8 dry human mandibles from the discipline of anatomy of São José dos Campos Dental School, São Paulo State University, in Brazil. The sample was divided into 2 groups as detailed in Table I .
| Central incisor | Lateral incisor | Canine | First premolar | Second premolar | |
|---|---|---|---|---|---|
| Group 1 | 3 | 4 | 8 | 5 | 4 |
| Group 2 | 2 | 5 | 7 | 6 | 5 |
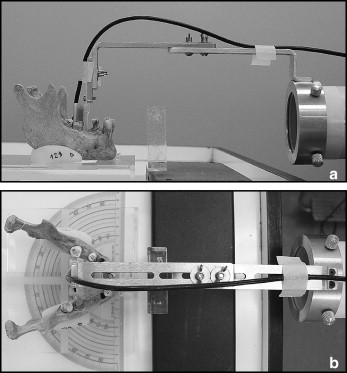
One pair of acrylic wedges was made for each mandible. These wedges served as supports to keep the occlusal plane parallel to the horizontal plane. The set was placed on a special device designed for controlling the angle of the x-ray beam. This device included an acrylic platform mounted on a protractor.
The teeth were removed from their sockets to measure their original length with digital calipers (Mitutuyo Dial Calipers, Tokyo, Japan). Then the teeth were replaced in their sockets and x-rayed with an intraoral x-ray device (model 765DC, Gendex Dental Systems, Milan, Italy) at 65 kV and 7 mA, and a Gendex Visualix CCD sensor (Dentsply Italia, Milan, Italy). The exposure time was 0.025 seconds for all teeth.
To standardize the images, the sensor was placed on an aluminum device connected to the x-ray cylinder. This device was designed to keep the sensor plane perpendicular to the central x-ray beam. The horizontal arm of the device was adjustable so that the target-sensor distance could be kept constant at 40 cm. The acrylic wedges of the mandibles were fixed to the plate with double-faced tape, and the mandibles were placed so that the central x-ray beam was positioned at 0° horizontally and guided perpendicularly to the center of the object and perpendicularly to the long axis of the teeth. A transparent, 1.8-cm thick, acrylic plate was interposed between the source and the object to simulate the soft tissues ( Fig 1 ).
After the initial radiograph, the teeth were removed from their sockets, and resorptions were simulated on their roots by wearing their lingual or apical aspect with spherical carbide burrs attached to an electric rotatory tool (Dremel 300 series, Robert Bosch Tool, Breda, The Netherlands). Simulations of apical root resorptions were made in the teeth of group 1, and simulations of lingual root resorptions were made in the teeth of group 2. The wearing on the apical aspect of the root was made in steps of approximately 0.5 mm up to about 2 mm. After each wearing, the length of the tooth was remeasured. The lingual root resorptions were simulated with spherical carbide burrs numbers ¼, 2, 3, and 4 corresponding to diameters of 0.5, 1.0, 1.2, and 1.4 mm, respectively. These burrs were used in sequence to produce cavities of 0.4, 0.9, 1.1, and 1.3 mm deep, respectively. During the wearing, the burrs were guided perpendicularly to the surface of the tooth with a workstation model (Dremel 200, Robert Bosch Tool) for better control of the amount of wearing. After each step of wearing, the teeth were put back into their sockets for new radiographs. A total of 5 images (1 reference and 4 subsequent) were obtained for each tooth.
The images were saved in tagged image file format (TIFF) and imported to Regeemy Image Registration and Mosaicking (version 0.2.43-RCB, DPI-INPE, São José dos Campos, São Paulo, Brazil). This software executes image registration—ie, corrects geometric discrepancies and equalizes the contrast of 2 sequential radiographs before the use of the digital subtraction technique. The reference image (radiograph taken before simulation of resorption) was selected as image 1, and the images after each step of resorption were selected as image 2. Reference points were selected on both images. These reference points served as coordinates for the software to correct the geometry of the second image according to the first image. In this study, the reference points were selected automatically by the software.
Each subsequent image was registered a posteriori. Then each of these images was subtracted from the initial image with Image Tool (University of Texas Health Science Center at San Antonio; ftp://maxrad6.uthscsa.edu). The subtracted images were saved in TIFF.
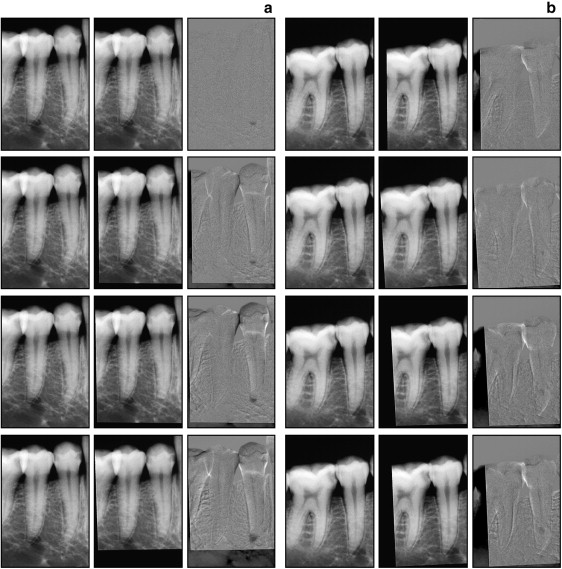
A total of 750 images (250 pairs of digital radiographs, initial and second images, and 250 subtracted) were obtained ( Fig 2 ). The pairs of digital radiographs were randomly numbered and placed in a PowerPoint presentation (PowerPoint 2000; Microsoft, Istanbul, Turkey) with a black background. The subtractions were also randomly numbered and placed in another PowerPoint presentation. Three oral radiologists evaluated the images with a 17-in, 0.28 pitch, CRT monitor (LG Studio Works, LG Electronics, Taubaté, Brazil). They were not allowed to use image enhancement tools. The examiners ranked the condition of the root according to a 5-point scale: 1, resorption definitely present; 2, resorption probably present; 3, resorption uncertain; 4, resorption probably absent; and 5, resorption definitely absent. The evaluations were repeated after 30 days.
Results
Cohen’s kappa index (κ) indicates whether intraexaminer and interexaminer agreement is null (κ = 0) or not null (κ >0). The kappa index is interpreted according to Table II .
| Range | Degree of concordance |
|---|---|
| <0.00 | No agreement |
| 0.00-0.20 | Slight agreement |
| 0.21-0.40 | Fair agreement |
| 0.41-0.60 | Moderate agreement |
| 0.61-0.80 | Substantial agreement |
| 0.81-1.00 | Almost perfect agreement |
Table III shows the intraexaminer and interexaminer agreement indexes. Intraexaminer agreement was between substantial and almost perfect. The agreement of all examiners was better with the subtractions, but the performance with the digital radiographs was considered good.
| Examiner | Apical | Lingual | |||
|---|---|---|---|---|---|
| DR | DSR | DR | DSR | ||
| Intraexaminer | A 1 × A 2 | 0.716 | 0.904 | 0.662 | 0.886 |
| B 1 × B 2 | 0.697 | 0.919 | 0.810 | 0.962 | |
| C 1 × C 2 | 0.779 | 0.926 | 0.830 | 0.902 | |
| Interexaminer | A × B | 0.590 | 0.945 | 0.616 | 0.924 |
| A × C | 0.653 | 0.884 | 0.672 | 0.844 | |
| B × C | 0.714 | 0.893 | 0.811 | 0.838 | |
The level of agreement between examiner A and the others was smaller with the digital radiographs. However, the levels of agreement between all examiners were almost perfect for both lingual and apical resorptions when DSR was used.
The receiver-operating characteristic (ROC) curve was used to verify which method was more precise in the detection of root resorptions; the results were compared with the gold standard (actual wearing). The ROC curve is the method of choice to determine the relationship between the sensitivity and specificity of a clinical test for a variety of cut points, thus allowing the determination of an optimal cut point. Sensitivity is defined as the probability that the disease is diagnosed when it is actually present (true-positive rate), and specificity is the probability that the disease is diagnosed as absent when it is truly absent (true-negative rate). Ideally, both sensitivity and specificity are expected to be the same. To construct an ROC curve, the sensitivity and specificity of the test for each possible cut point value must be calculated. To make the ROC graph, the x-axis is 1 minus the specificity (false-positive rate), and the y-axis is the sensitivity (true-positive rate). Then a diagonal line is drawn in the graph from 0 and 0 in the lower left corner to 1 and 1 in the upper right corner. This line reflects the characteristics of a test with no discriminating power. The closer the graph is to the upper left corner (0, 1), the better the test is at discriminating between cases and noncases. An index of the goodness of the test is the area under the curve. A perfect test has an area of 1.0, whereas a nondiscriminating test (one that falls in the diagonal) has an area of 0.5. In this case, the decision between presence or absence of the lesion was made by chance.
The areas under the ROC curves corresponding to the evaluation of each examiner using DR and DSR were compared. The differences between the results from the ROC curves are given in Table IV and represented in Figure 3 .
| Examiner | Apical | Lingual | ||
|---|---|---|---|---|
| ≠ between areas | P value | ≠ between areas | P value | |
| A DR × A DSR | 0.047 | 0.286 | 0.059 | 0.341 |
| B DR × B DSR | 0.083 | 0.085 | 0.065 | 0.288 |
| C DR × C DSR | 0.019 | 0.604 | 0.057 | 0.317 |
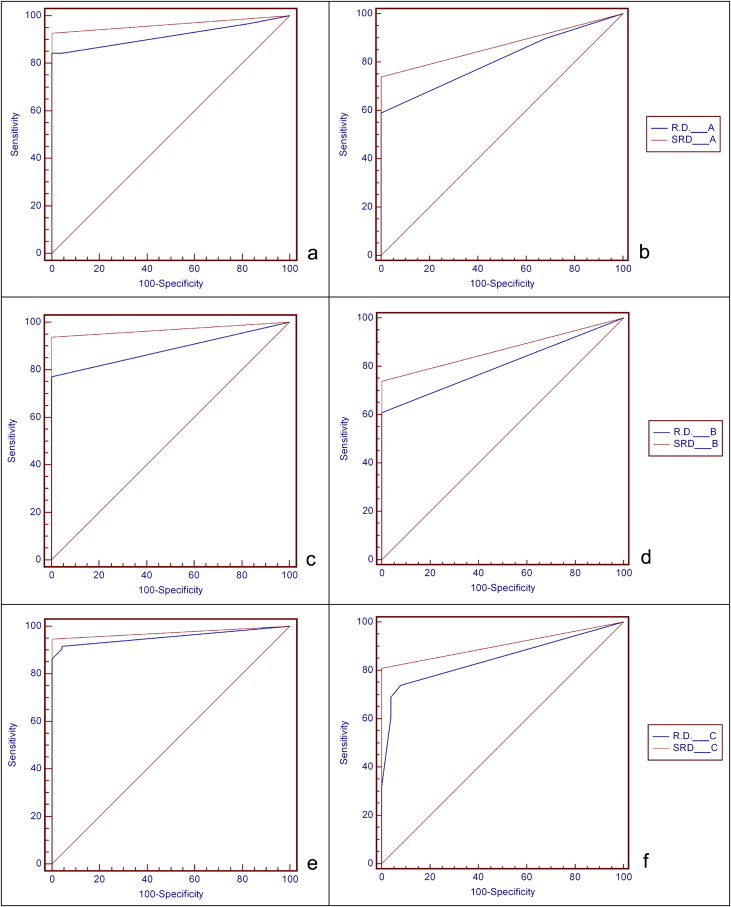
The difference between the areas under the ROC curves of DR and DSR were not statistically significant for any examiner ( Table IV ). However, the areas under the ROC curves for the DSR were greater than those provided by DR ( Fig 3 ). Greater areas under the ROC curves were also observed when lesions were analyzed according to their size ( Table V ).
| Size of lesion | Examiner | ||||||
|---|---|---|---|---|---|---|---|
| DR | DSR | ||||||
| A | B | C | A | B | C | ||
| Apical | No lesion/≈0.5 mm | 0.723 ∗ | 0.625 ∗ | 0.844 ∗ | 0.875 † | 0.917 | 0.917 |
| No lesion/≈1 mm | 1.000 | 0.917 | 0.977 | 0.979 | 0.958 | 0.979 | |
| No lesion/≈1.5 mm | 0.962 | 1.000 | 1.000 | 1.000 | 1.000 | 1.000 | |
| No lesion/≈2 mm | 0.982 | 1.000 | 1.000 | 1.000 | 1.000 | 1.000 | |
| Lingual | No lesion/burr ¼ | 0.554 ∗ | 0.520 ∗ | 0.559 ∗ | 0.500 ∗ | 0.520 ∗ | 0.660 ∗ |
| No lesion/burr 2 | 0.804 † | 0.820 ‡ | 0.913 | 0.980 | 0.980 | 1.000 | |
| No lesion/burr 3 | 0.926 | 0.920 | 0.946 | 1.000 | 1.000 | 0.980 | |
| No lesion/burr 4 | 0.959 | 0.960 | 0.972 | 1.000 | 0.980 | 0.980 | |
Stay updated, free dental videos. Join our Telegram channel
VIDEdental - Online dental courses


