Introduction
Our objective was to comparatively evaluate different bracket types (conventional, active self-ligating, and passive self-ligating) combined with broad archwires in terms of maxillary dental arch widths and molar inclinations.
Methods
Forty-six patients aged 13 to 17 years with moderate maxillary and mandibular crowding and a Class I malocclusion were included in this prospective clinical trial. The primary outcome measures were changes in maxillary arch width dimensions and molar inclinations. The secondary outcome measures were changes in maxillary and mandibular incisor inclinations. Group I included 15 patients (mean age, 14.4 ± 1.5 years) treated with 0.022-in active self-ligating brackets. Group II included 15 patients (mean age, 14.4 ± 1.6 years) treated with 0.022-in Roth prescription conventional brackets. Group III was a retrospective group of 16 patients (mean age, 14.8 ± 1.0 years) previously treated with 0.022-in passive self-ligating brackets. Each participant underwent alignment with the standard Damon archwire sequence. Whereas the differences among groups were evaluated by 1-way analysis of variance or Kruskal-Wallis tests, the paired-samples t test was applied for intragroup comparisons. For all possible multiple comparisons, the Bonferroni correction was applied to control for type I error.
Results
The maxillary intercanine, interpremolar, and intermolar widths were significantly greater after treatment in each bracket group. However, when the levels of expansion achieved among the 3 groups were compared, no significant difference was found. Although all posteroanterior cephalometric variables showed significant changes during treatment in all groups, these changes were not significant among the groups. A statistically significant labial proclination of the teeth was seen in each group.
Conclusions
No differences in maxillary arch dimensional changes or molar and incisor inclination changes were found in conventional and active and passive self-ligating brackets used with broad archwires.
Highlights
- •
Self-ligating and conventional brackets were used with broad archwires.
- •
Maxillary arch dimension and incisor-molar inclination changes were evaluated.
- •
No differences were found in either.
New bracket systems with different ligating features have been manufactured by almost every orthodontic company in the last decade. Different passive and active self-ligating brackets have been introduced with claims of reduced friction, light forces, efficient sliding mechanics, and easy clinical application. No studies support a significant difference between self-ligating and conventional brackets with regard to efficiency. These bracket systems differ with respect to clip properties, wire types, and sequences.
The Damon passive self-ligating system introduced broad archwires and a passive clip with the claim of posterior expansion with bodily movement or minimal tipping of the teeth. The results of previous studies indicated greater intermolar arch width increases in the Damon groups than in the conventional bracket groups. Furthermore, a recent study showed that broader forms of copper-nickel-titanium and stainless steel archwires in the Damon group could expand the maxillary arch as much as the conventional straight-wire system combined with the quad-helix appliance. In contrast, several studies have shown no differences between the Damon passive self-ligating system and conventional brackets with respect to transverse arch dimensional changes. Active and passive self-ligating systems were also compared according to maxillary arch dimensional changes. Transversal dimensions at the second premolar and the first molar were greater in the passive self-ligating group compared with the active self-ligating group. On the contrary, no difference in maxillary arch dimensional changes during alignment was found among active self-ligating, passive self-ligating, and conventional brackets.
Manufacturers of both active and passive self-ligating brackets have stated the advantages of better torque control, but wide variations in torque expression have been reported. Whereas passive brackets are claimed to produce a “lip bumper” effect that results in significantly less labial inclination of the incisors, the manufacturers of active self-ligating brackets claim better torque control with the active clip.
However, the results in the literature do not provide a clear comparison of these bracket systems in terms of arch width and incisor and molar inclinations because different archwire types and sequences are used in each system. The main purpose of this study was to comparatively evaluate active self-ligating, passive self-ligating, and conventional brackets used with broad Damon archwires in terms of maxillary arch dimensional and molar inclination changes. The secondary outcome measures were changes in maxillary and mandibular incisor inclinations.
Material and methods
A total of 46 patients who were referred to the Department of Orthodontics at Hacettepe University, Ankara, Turkey, were included in this prospective study. Ethical approval was obtained from the university institutional review board (number 14/587-25). The patients were selected according to the following inclusion criteria: between 13 and 17 years of age at the start of the treatment, past the pubertal growth spurt, with moderate maxillary and mandibular crowding and a Class I malocclusion, and nonextraction treatment in both arches. The levels of crowding for the treatment groups are shown in Table I . The Hayes-Nance analysis was used to calculate the levels of maxillary and mandibular crowding on the dental casts taken before the treatment.
| Variable | Group I, mean (SD) or n (%) | Group II, mean (SD) or n (%) | Group III, mean (SD) or n (%) | P value |
|---|---|---|---|---|
| Age (y) | 14.4 (1.5) | 14.4 (1.6) | 14.8 (1.0) | 0.540 |
| Sex | 0.006 | |||
| Male | 3 (20.0%) | 6 (40.0%) ∗ | 0 (0.0%) ∗ | |
| Female | 12 (80.0%) | 9 (60.0%) ∗ | 16 (100.0%) ∗ | |
| Mandibular crowding (mm) | 4.1 (0.99) | 3.2 (1.12) | 3.8 (0.93) | 0.066 |
| Maxillary crowding (mm) | 4.0 (0.77) † | 3.1 (0.74) ∗,† | 3.9 (1.12) ∗ | 0.011 |
| Treatment duration (mo), median (minimum-maximum) | 14.6 (8.2-22.4) | 13.4 (11-25) | 13.2 (10-22) | 0.965 |
Group I included 15 patients (mean age, 14.4 ± 1.5 years) treated with the 0.022-in Nexus active self-ligating bracket (Ormco, Orange, Calif). Group II included 15 patients (mean age, 14.4 ± 1.6 years) treated with the 0.022-in Roth prescription bracket (Forestadent, Pforzheim, Germany). The brackets in the conventional bracket group were ligated with stainless steel ligatures. The patients in groups I and II were prospectively selected and treated by 1 examiner (B.A-G.) based on the same criteria to select and treat the patients of group III. The subjects of groups I and II were allocated sequentially to either treatment system before the start of treatment. Group III was a retrospective group of 16 patients (mean age, 14.8 ± 1.0 years) treated with the 0.022-in Damon 3MX passive self-ligating appliance system (Ormco/A Company, San Diego, Calif). The patients in group III were previously treated by a different examiner (E.A.), and their data were used for this study. For all groups, the following Ormco archwires were sequentially used: 0.014-, 0.018-, 0.014 × 0.025-, and 0.017 × 0.025-in Damon arch form copper-nickel-titanium (35°C), followed by 0.017 × 0.025-in and 0.019 × 0.025-in Damon arch form stainless steel archwires. All patients had maxillary constriction caused by a dental transverse discrepancy. Therefore, in all 3 groups, we applied broad Damon archwires. The archwires were left in place for a minimum of 6 weeks. However, this period was extended until leveling was achieved if necessary.
All mechanics were consistent with a nonextraction treatment plan. No other appliances, such as headgear, Herbst, lip bumper, or distalizing appliances, were used. In all groups, the appliances were removed, and posttreatment records were taken when a Class I canine-molar relationship and ideal overjet and overbite were achieved.
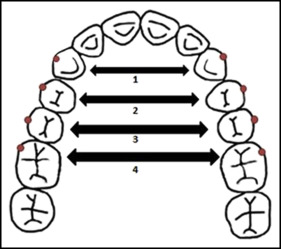
A digital caliper was used to measure the following transverse maxillary dimensions on the pretreatment (T0) and posttreatment (T1) models: (1) intercanine width, the distance between the maxillary right and left canine cusp tips; (2) interfirst premolar width, the distance between the buccal cusp tips of the maxillary right and left first premolars; (3) intersecond premolar width, the distance between the buccal cusp tips of the maxillary right and left second premolars; and (4) intermolar width, the distance between the mesiobuccal cusp tips of the maxillary right and left first molars ( Fig 1 ).
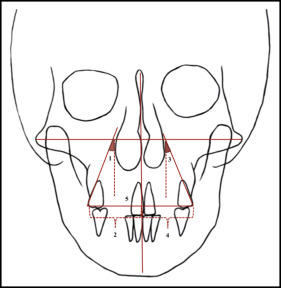
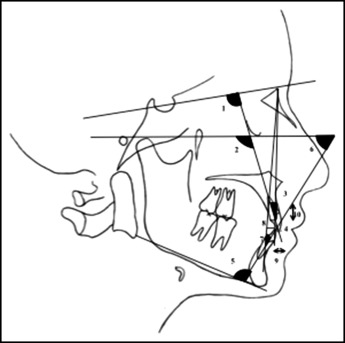
The pretreatment and posttreatment posteroanterior and lateral cephalometric radiographs of each subject were digitally traced using Quick Ceph Studio software (Quick Ceph Systems, San Diego, Calif). The cephalograms of each patient were traced by 1 examiner (E.A.). The measurements are illustrated in Figures 2 and 3 .
Statistical analysis
Data analysis was performed by a private biostatistics expert who was blinded to the groups using SPSS for Windows (version 11.5; SPSS, Chicago, Ill).
Descriptive statistics were expressed as numbers and percentages for sex, medians (minimum and maximum) for treatment duration, and means and standard deviations for the rest of the variables.
The Shapiro-Wilk test was used to determine whether the continuous data were normally distributed. Homogeneity of variances was evaluated with the Levene test. All variables except treatment duration met the parametric test assumptions.
The paired t test was used to evaluate the statistical significance of the mean differences between the pretreatment and posttreatment measurements. The mean differences among the 3 groups were compared using 1-way analysis of variance (ANOVA), and the medians were compared with the Kruskal-Wallis test. If the P value from the 1-way ANOVA was statistically significant, the post hoc Tukey honestly significant difference test was used to determine which group differed from which others. Categorical data (sex) were analyzed by the Pearson chi-square or the Fisher exact test, where applicable. The intraexaminer reproducibility of the cephalometric and dental model measurements was assessed by replication of the measurements at 4-week intervals by the same examiner (E.A.). Reliability was calculated by intraclass correlation coefficients and 95% confidence intervals for each clinical parameter ( Table II ).
| Before treatment | After treatment | |||||
|---|---|---|---|---|---|---|
| ICC | 95% CI | ICC | 95% CI | |||
| Lower | Upper | Lower | Upper | |||
| 3-3 (mm) | 0.957 | 0.923 | 0.976 | 0.713 | 0.536 | 0.830 |
| 4-4 (mm) | 0.975 | 0.955 | 0.986 | 0.898 | 0.823 | 0.942 |
| 5-5 (mm) | 0.993 | 0.987 | 0.996 | 0.971 | 0.949 | 0.984 |
| 6-6 (mm) | 0.958 | 0.925 | 0.976 | 0.948 | 0.907 | 0.971 |
| UR6-ML (mm) | 0.910 | 0.844 | 0.949 | 0.919 | 0.858 | 0.954 |
| UR6-ML (°) | 0.944 | 0.901 | 0.969 | 0.942 | 0.899 | 0.968 |
| UL6-ML (mm) | 0.907 | 0.838 | 0.947 | 0.869 | 0.776 | 0.925 |
| UL6-ML (°) | 0.996 | 0.992 | 0.998 | 0.945 | 0.903 | 0.969 |
| UR6-UL6 (mm) | 0.995 | 0.991 | 0.997 | 0.989 | 0.980 | 0.994 |
| U1-NA (°) | 0.997 | 0.995 | 0.999 | 0.995 | 0.991 | 0.997 |
| U1-NA (mm) | 0.992 | 0.985 | 0.996 | 0.990 | 0.982 | 0.994 |
| U1-SN (°) | 0.986 | 0.975 | 0.992 | 0.988 | 0.978 | 0.993 |
| U1-FH (°) | 0.985 | 0.973 | 0.992 | 0.979 | 0.962 | 0.988 |
| IMPA (°) | 0.993 | 0.988 | 0.996 | 0.995 | 0.990 | 0.997 |
| FMIA (°) | 0.998 | 0.996 | 0.999 | 0.984 | 0.971 | 0.991 |
| L1-NB (°) | 0.996 | 0.992 | 0.998 | 0.994 | 0.989 | 0.997 |
| L1-NB (mm) | 0.997 | 0.994 | 0.998 | 0.998 | 0.996 | 0.999 |
| Overjet (mm) | 0.961 | 0.931 | 0.978 | 0.809 | 0.681 | 0.889 |
| Overbite (mm) | 0.978 | 0.960 | 0.988 | 0.925 | 0.870 | 0.958 |
A P value less than 0.05 was considered statistically significant. For all possible multiple comparisons, the Bonferroni correction was applied to control for type I error.
Results
Baseline demographic and clinical characteristics of the patients are presented in Table I .
Table III shows the mean changes in the maxillary arch width for each appliance system measured from the dental casts. The results showed that intercanine, interfirst premolar, intersecond premolar, and intermolar widths were significantly greater after treatment with all appliance systems ( Table III ). However, when the levels of expansion achieved among the groups were compared, no significant difference was found.
| Variable | T0 mean (SD) | T1 mean (SD) | P value ∗ | Delta mean (SD) | 95% CI | P value † | Mean difference ‡ |
|---|---|---|---|---|---|---|---|
| 3-3 | 0.590 | ||||||
| Group I | 34.37 (2.78) | 36.40 (2.08) | <0.0001 | 2.03 (1.33) | 1.29-2.76 | 0.50 (−0.88 to 1.88) | |
| Group II | 34.32 (1.92) | 36.34 (1.67) | <0.0001 | 2.02 (0.95) | 1.49-2.54 | 0.51 (−0.87 to 1.89) | |
| Group III | 33.31 (3.20) | 35.84 (2.10) | 0.0003 | 2.53 (2.16) | 1.38-3.68 | 0.01 (−1.39 to 1.41) | |
| 4-4 | 0.242 | ||||||
| Group I | 40.56 (2.62) | 44.59 (1.85) | <0.0001 | 4.03 (1.53) | 3.18-4.87 | 1.04 (−0.65 to 2.74) | |
| Group II | 40.77 (2.17) | 44.81 (1.90) | <0.0001 | 4.05 (1.75) | 3.08-5.02 | 1.02 (−0.68 to 2.71) | |
| Group III | 38.22 (2.56) | 43.28 (1.96) | <0.0001 | 5.07 (2.41) | 3.79-6.35 | −0.02 (−1.74 to 1.70) | |
| 5-5 | 0.024 | ||||||
| Group I | 46.11 (3.43) | 49.63 (3.15) | <0.0001 | 3.52 (1.21) | 2.85-4.20 | 1.38 (−0.14 to 2.90) | |
| Group II | 46.24 (2.52) | 49.47 (2.58) | <0.0001 | 3.23 (0.94) | 2.71-3.76 | 1.67 (0.15 to 3.19) | |
| Group III | 42.89 (2.99) | 47.79 (2.58) | <0.0001 | 4.9 (2.55) | 3.54-6.26 | 0.29 (−1.25 to 1.83) | |
| 6-6 | 0.200 | ||||||
| Group I | 51.14 (4.25) | 53.48 (3.50) | <0.0001 | 2.34 (1.14) | 1.71-2.97 | 1.09 (−0.43 to 2.61) | |
| Group II | 51.75 (2.50) | 54.36 (2.37) | 0.0003 | 2.61 (2.13) | 1.43-3.79 | 0.82 (−0.70 to 2.34) | |
| Group III | 48.59 (3.27) | 52.02 (3.15) | <0.0001 | 3.43 (1.80) | 2.47-4.39 | −0.27 (−1.81 to 1.27) |
Posteroanterior cephalometric measurements for the 3 groups at T0 and T1 are shown in Table IV . The angle between the maxillary molar axis and the facial midline (UR6-ML and UL6-ML) and the perpendicular distance between the maxillary molars and the facial midline (UR6-ML and UL6-ML) increased significantly in each treatment group from T0 to T1. However, these measurements were not significantly different from each other.
| Variable | T0 mean (SD) | T1 mean (SD) | P value ∗ | Delta mean (SD) | 95% CI | P value † | Mean difference ‡ |
|---|---|---|---|---|---|---|---|
| UR6-ML (mm) | 0.430 | ||||||
| Group I | 26.00 (1.73) | 27.27 (2.01) | <0.0001 | 1.28 (0.71) | 0.89-1.67 | 0.40 (−0.50 to 1.30) | |
| Group II | 26.90 (1.46) | 28.14 (1.60) | 0.0003 | 1.24 (0.99) | 0.69-1.79 | 0.44 (−0.46 to 1.34) | |
| Group III | 27.87 (1.66) | 29.54 (1.99) | <0.0001 | 1.68 (1.30) | 0.99-2.37 | 0.04 (−0.88 to 0.95) | |
| UR6-ML (°) | 0.833 | ||||||
| Group I | 24.27 (1.96) | 28.26 (2.84) | <0.0001 | 4.00 (2.49) | 2.62-5.37 | −0.05 (−2.16 to 2.06) | |
| Group II | 24.76 (2.54) | 28.27 (1.87) | <0.0001 | 3.51 (2.07) | 2.37-4.66 | 0.43 (−1.67 to 2.54) | |
| Group III | 26.08 (3.84) | 30.03 (3.47) | <0.0001 | 3.95 (2.63) | 2.54-5.35 | 0.48 (−1.66 to 2.62) | |
| UL6-ML (mm) | 0.997 | ||||||
| Group I | 26.16 (1.61) | 27.13 (2.04) | 0.0028 | 0.97 (1.04) | 0.40-1.56 | −0.01 (−0.80 to 0.78) | |
| Group II | 27.34 (2.09) | 28.33 (1.96) | <0.0001 | 0.99 (0.74) | 0.58-1.40 | −0.02 (−0.81 to 0.77) | |
| Group III | 28.31 (1.37) | 29.27 (1.37) | 0.0007 | 0.97 (0.91) | 0.48-1.45 | −0.02 (−0.82 to 0.79) | |
| UL6-ML (°) | 0.569 | ||||||
| Group I | 26.50 (3.91) | 29.88 (3.16) | <0.0001 | 3.37 (1.89) | 2.33-4.42 | 0.82 (−1.14 to 2.79) | |
| Group II | 25.52 (2.70) | 29.08 (3.07) | 0.0002 | 3.56 (2.77) | 2.03-5.10 | 0.63 (−1.33 to 2.60) | |
| Group III | 27.31 (3.49) | 31.50 (3.33) | <0.0001 | 4.20 (2.03) | 3.12-5.28 | −0.19 (−2.19 to 1.81) | |
| UR6-UL6 (mm) | 0.983 | ||||||
| Group I | 52.28 (2.83) | 54.17 (3.00) | <0.0001 | 1.89 (0.86) | 1.42-2.37 | −0.09 (−1.29 to 1.11) | |
| Group II | 54.30 (3.12) | 56.16 (3.29) | 0.0002 | 1.86 (1.47) | 1.05-2.68 | −0.06 (−1.26 to 1.14) | |
| Group III | 56.98 (2.47) | 58.78 (2.73) | 0.0006 | 1.80 (1.65) | 0.92-2.68 | 0.03 (−1.19 to 1.25) |
Stay updated, free dental videos. Join our Telegram channel
VIDEdental - Online dental courses


