Introduction
The purpose of this study was to examine the maxillary response on the transverse dimensions to rapid palatal expansion (RPE) by using cone-beam computed tomography (CBCT).
Methods
Twenty-four children (average age, 9.9 years) who had RPE treatment with a bonded expander were included. Pretreatment orthodontic records (T1) and immediately after expansion (T2) CBCT images were taken for all patients. For each patient, the width of the nasal cavity at the level of the maxillary first permanent molar and second deciduous molar (or second permanent premolar), the width of the maxillary basal bone, and the width of the midpalatal suture at the level of the second deciduous molar (or the second permanent premolar), the first deciduous molar (or first permanent premolar), and the deciduous canine (or permanent canine) at T1 and T2 were measured. In addition, the amount of tipping for both the maxillary right and left first permanent molars was measured.
Results
From T1 to T2, mean increases in nasal width, related to the mean jackscrew opening (8.19 mm), occurred at the levels of the first permanent molars of 33.23% (2.73 mm, P <0.05) and the second deciduous molars of 37.32% (3.06 mm, P <0.05). Significant increases in basal bone of the maxilla were found at all levels ( P <0.05), with mean increases of 40.65% (3.33 mm), 44.08% (3.49 mm), 46.73% (3.83 mm), and 46.83% (3.62 mm) of the mean jackscrew opening at the levels of the first permanent molars, and the second deciduous molars, first deciduous molars, and deciduous canines, respectively. Significant openings in the midpalatal sutures was found at all levels ( P <0.05), with mean increases of 52.82% (4.33 mm), 53.23% (4.36 mm), 54.35% (4.46 mm), and 52.77% (4.33 mm) of the jackscrew opening at the levels of the first permanent molars, and the second deciduous molars, first deciduous molars, and deciduous canines, respectively. The right first molar tipped buccally an average of 6.2° ( P <0.05), and the left first molar tipped buccally 5.6° ( P <0.05).
Conclusions
After RPE, significant increases in the transverse dimensions of the nasal cavity, the maxillary basal bone, and the midpalatal suture opening occurred, with the greatest increase in the midpalatal suture followed by basal bone and nasal cavity. The midpalatal suture opened in a parallel fashion. Moreover, significant buccal tipping occurred on both maxillary first molars.
Rapid palatal expansion (RPE) has been widely used by many orthodontists to increase the maxillary transverse dimension in young patients. Throughout the years, many types of palatal expanders and their effects on facial structures have been studied. Historically, these studies have been conducted by using traditional lateral and posteroanterior (PA) cephalograms, occlusal films, and dental casts. More recently, computed tomography (CT) scanning has been used by investigators to study the effects of RPE on facial structures.
Haas, and Memikoglu and Iseri demonstrated increases in the width of the nasal cavity after RPE by using PA cephalograms. Podesser et al found an increase in nasal cavity width at the level of the maxillary first molars using CT scanning. Garib et al reported an increase in the width of the nasal floor after RPE using CT scanning and found it to be one-third of the amount of the jackscrew opening of the expander. Using cone-beam CT (CBCT), Garrett et al found a nasal width increase of 37.2% of the mean hyrax appliance expansion.
Haas suggested that the midpalatal suture opens after RPE in a parallel manner anteroposteriorly and triangularly infero-superiorly, with the apex in the nasal cavity. However, Wertz and Dreskin reported that after RPE the midpalatal suture opening was not parallel, with the widest opening at the anterior nasal spine (ANS) and diminishing posteriorly. Using CT scanning, Habersack et al found a parallel opening of the midpalatal suture in a young patient after RPE, whereas an older patient had a pyramidal opening of the suture with jigsaw-like rupture lines indicating greater suture interdigitation. Silva Filho et al found that the posterior nasal spine (PNS) opened to a lesser extent than did the ANS in children in the deciduous and mixed dentition stages on CT images after RPE. Podesser et al evaluated the effects of RPE in 9 children using CT imaging. They reported that the average expansion measured at the molar crowns was 3.6 mm, whereas the actual midpalatal sutural opening was as low as 1.6 mm. Using CBCT, Garrett et al found more skeletal expansion of the maxilla in the first premolar region and less in the first molar region: 55% and 38% of the hyrax appliance expansion, respectively.
Chung and Font examined 20 adolescents expanded with Haas-type expanders. They found that 9.7% of interpremolar expansion and 4.3% of intermolar expansion were due to buccal crown tipping, but the degree of tipping was not determined because of the inability to measure the axial inclination from PA cephalograms. Haas suggested that more bodily movement and less dental tipping were produced when acrylic palatal coverage was added to support the appliance. Garib et al examined the dentoskeletal effects of tooth tissue-borne and tooth-borne expanders, and concluded that RPE led to buccal movement of the maxillary posterior teeth by tipping and bodily translation in both groups. However, the tooth tissue-borne expander produced greater changes in the axial inclination of the supporting teeth, especially the first premolars compared with the tooth-borne expander. Kilic et al reported that both hyrax (tooth borne) and acrylic bonded (tooth tissue-borne) palatal expanders produced significant buccal tipping of supporting teeth, but the amount of tipping was less in the tooth tissue-borne appliance.
The purpose of this study was to use CBCT to examine the effects of RPE on the widths of the nasal cavity, maxillary basal bone, and midpalatal suture, and the inclination of maxillary first molars with a bonded Haas-type expander.
Material and methods
Twenty-four healthy children (mean age, 9.9 years; range, 7.8–12.8 years; 14 boys, 10 girls) who required RPE treatment, from a private orthodontic practice, were included for the study. The skeletal age of each patient was determined from a hand-wrist radiograph, according to the standards of Greulich and Pyle. The mean skeletal age of the patients was 10.3 years (range, 7.5–13 years).
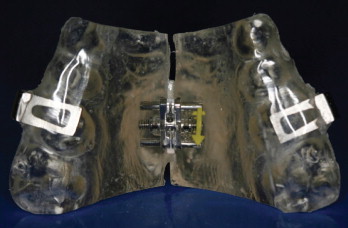
A pretreatment CBCT image (T1) was taken as part of the initial orthodontic records of all patients. The scans were obtained with an I-CAT machine (Imaging Sciences International, Hatfield, Pa). For each patient, a bonded Haas-type maxillary expander was cemented in place. The design of the expander was full occlusal and palatal acrylic coverage. The occlusal coverage included the deciduous canine (or the permanent canine if in the arch) through to the first molar ( Fig 1 ). The appliances were all made by the same orthodontic laboratory. Before cementation, 2 small holes were drilled on either side of the expander in both anterior and posterior regions. Once the expander was cemented in place, the distance between the 2 holes was measured with a digital caliper. Expansion was carried out as 2 turns per day (0.2 mm per turn) until the required expansion was complete.
An immediate postexpansion CBCT image (T2) was taken of each patient on the day the appliance was tied off when adequate expansion was achieved. To decrease the amount of radiation, the posttreatment scan had a smaller window, which decreased the imaging time from 20 to 10 seconds and halved the amount of radiation. A digital caliper was used to measure the distance between the 2 acrylic halves after expansion. The amount of activation of the jackscrew was measured by averaging the difference in distance between the T1 and T2 images in the anterior and posterior areas. The mean interval between the T1 and T2 was 66 days (range, 21–152 days), but the mean active expansion period (from beginning of expansion to T2) was 30 days (range, 21–42 days). None of the patients received any brackets or wires in the maxillary arch until the CBCT images were taken at T2.
All CBCT images were oriented and standardized by using Dolphin Imaging (version 10.5, Dolphin Imaging & Management Solutions, Chatsworth, Calif). Each head was oriented in 3 planes of space for frontal, right lateral, and left lateral views. The head was oriented inthe frontal view with the floor of the orbits parallel to the floor. The right lateral view allowed placement of the head so that the Frankfort horizontal line (upper rim of external auditory meatus, porion, to the inferior border of the orbital rim, orbitale) was parallel to the floor. Both the right and left posterior borders of the ramus and the angle of the mandible were superimposed to the best possible fit. The left lateral view was also examined to ensure that the Frankfort horizontal was parallel to the floor, and the borders of the ramus and the angle of the mandible were superimposed as best fit.
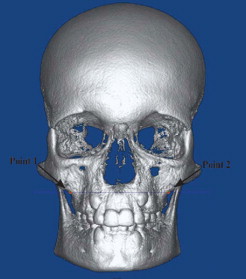
The first set of data was calculated from the patient’s 3D skull view. Quantitative evaluation of the parameters was based on the identification and registration of a series of points. Points 1 and 2 were reference points that represented the levels of basal bone of the maxilla. These landmarks were plotted from the frontal view of the skull on both sides. These landmarks were defined as the most superior aspect of the concavity of the maxillary bone as it joined the zygomatic process ( Fig 2 ).
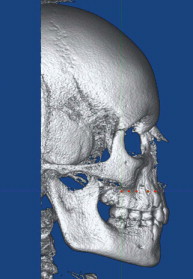
From point 1, a horizontal reference line parallel to the floor was drawn. Points 3, 4, 5, and 6 were marked on the right lateral view of the 3D skull on the horizontal reference line and above the center of the clinical crown of the maxillary first molar, second deciduous molar (or second premolar if in the arch), first deciduous molar (or first premolar if in the arch), and canine, respectively ( Fig 3 ).
The same method was used for the left lateral view, but using point 2 to make a horizontal reference line. Points 7, 8, 9, and 10 were marked on the left lateral view of the 3D skull on the horizontal reference line of point 2 and above the center of the clinical crown of the maxillary first molar, second deciduous molar (or second premolar if in the arch), first deciduous molar (or first premolar if in the arch), and canine, respectively.
Once points 1 through 10 were plotted on the 3D skull, the axial section was brought into view to ensure that all points were plotted on the alveolar bone. The maxillary base width and the width of the suture opening were calculated from the axial view.
The measurement of the width of the maxillary base at the level of the maxillary first molars, second deciduous molars, first deciduous molars, and canines were measured as the distances between points 3 and 7, 4 and 8, 5 and 9, and 6 and 10, respectively ( Fig 3 ).
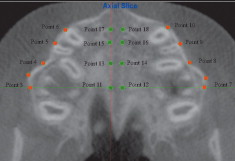
On the T2 images, once the maxillary base width had been recorded, the axial slice with points 1 through 10 plotted was used to measure the width of the suture opening. The image was adjusted at slice thickness distance 1.0 mm until the entire suture opening could be seen. Points 11 and 12 were marked at the horizontal level of point 3, which marked the maxillary right first molar. Point 11 was placed on the right border of the suture, and point 12 was placed on the left border of the suture. Point 13 was placed on the right border of the suture following the horizontal line of point 4 (right second deciduous molar), and point 14 was placed on the left border of the suture in the same horizontal plane. Point 15 was placed on the right border of the suture following the horizontal line of point 5 (right first deciduous molar), and point 16 was placed on the left border of the suture in the same horizontal plane. Point 17 was placed on the right border of the suture following the horizontal line of point 6 (right canine), and point 18 was placed on the left border of the suture in the same horizontal plane. The distances between points 11 and 12, 13 and 14, 15 and 16, and 17 and 18 were calculated, representing the distances between the suture opening at the level of the maxillary first permanent molar, second deciduous molar, first deciduous molar, and canine, respectively ( Fig 4 ).
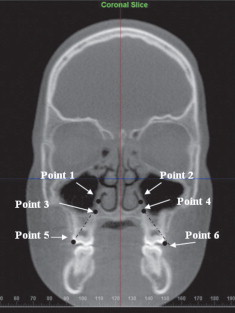
The second set of data for the coronal sections was collected and analyzed according to the guidelines of Podesser et al. For the molar slice, the most anterior slice showing the entire palatal root of the maxillary first molar was chosen. The second deciduous molar (or second premolar if present), and the first deciduous molar (or first premolar if present) were chosen as the most anterior slice on which the crown and root could be seen in their entire length, regardless of whether the tooth was the deciduous one or its permanentsuccessor.
Quantitative evaluation of the parameters was based on the identification and registration of a series of points, as suggested by Podesser et al. Points 1 and 2 were the lateral limits of the nasal cavity: point 1 was the lateral point on the lateral wall of the right nasal cavity with a line perpendicular to the floor. Point 2 was constructed on the lateral wall of the left nasal cavity from point 1 by using a line perpendicular to the floor. Points 3 and 4 represented the apices of the palatal roots of the first molars, right and left, respectively. Points 5 and 6 represented the tips of the mesiobuccal cusps of the maxillary first molars, right and left, respectively ( Fig 5 ). The following measurements were taken on each coronal section.