Introduction
The aim of this study was to evaluate soft tissue profile changes after a wide range of incisor movements in the anterior and posterior directions in nongrowing patients. Identifying baseline values more prone to substantial soft tissue profile changes was of high interest.
Methods
For this retrospective study, 47 pairs of lateral cephalograms of nongrowing white patients were superimposed. The cephalograms were taken with the same palatal implant in situ before and after treatment. To increase the accuracy of the measurements, the palatal implants were used as stable reference structures in close relation to the incisors.
Results
Horizontal changes of the most anterior point of the maxillary incisor showed a significant correlation to horizontal changes of the upper and lower lips ( P <0.001). For every millimeter of horizontal change of the most anterior point of the maxillary central incisor, a change of 0.59 mm at labrale superior can be expected. Also, the angulations of the upper and lower lips were significantly correlated to the most anterior point of the maxillary incisor. Lip retraction was less pronounced in patients with initially thicker lips than in those with thinner lips.
Conclusions
The major contributing factors for predicting the soft tissue profile change during orthodontic treatment are the amount of horizontal movement of the most anterior point of the maxillary incisor, the amount of bite opening, and the initial lip thickness. Although there are significant correlations between dental movements and soft tissue changes in larger samples, predictions for individuals may be inconsistent.
Highlights
- •
Cephalograms were superimposed to evaluate soft tissue changes after incisor movements.
- •
Rough-surfaced palatal implants were used as stable reference structures.
- •
Maxillary incisors showed significant correlations to lip changes.
- •
Lip retraction was less pronounced in subjects with greater initial lip thickness.
Patients who seek orthodontic treatment are often concerned with improving their appearance. Possible profile and soft tissue changes caused by orthodontic tooth movement therefore have high clinical relevance. The assessment and prediction of these soft tissue changes are challenging, mainly because of 3 difficulties.
First, facial changes caused by orthodontic treatment and growth are often intermingled. During growth, the soft tissue profile mostly follows the growth of the underlying hard tissues. Therefore, to examine soft tissue changes caused only by orthodontic treatment, the changes must be studied in nongrowing patients.
Second, most of the pertinent literature has evaluated extraction patients with incisor retraction. There are no studies on a wider range of incisor movements, including incisor protrusion. Based on the available literature, it seems that the response of the soft tissue profile to incisor retraction does not depend on the subject’s skeletal class, but ethnicity may have an influence. Hence, an evaluated sample should include movements in different directions and be stratified for ethnicity but not necessarily for skeletal pattern.
Third, in the past, the relationship between incisor and lip movements has been studied mostly by traditional superimpositions based on fairly stable anatomic structures. In contrast, superimposition of serial cephalograms based on metallic implants, as introduced by Björk, is considered the most precise and reliable technique. When comparing the 2 approaches, Gu and McNamara concluded that measured tooth movements can be distorted significantly when relying solely on anatomic superimpositions. Yet few authors have used the metallic implant protocol, probably because of its invasive nature.
Temporary anchorage devices have more recently enriched orthodontics, facilitating the treatment of complex orthodontic cases. Of special interest are sandblasted and acid-etched palatal implants, similar to short prosthetic dental implants, which were shown to produce more bone-to-implant contact than machined implants under orthodontic load and remain positionally stable ; this does not hold true for all temporary anchorage devices. This opens new opportunities because palatal implants can be used as ideal reference structures for local maxillary superimpositions.
The aim of this study was to evaluate soft tissue profile changes resulting from hard tissue changes in nongrowing patients of the same ethnicity. To increase the accuracy and validity of the assessed movements in both anterior and posterior directions, only superimpositions based on palatal implants as a stable reference were used.
Material and methods
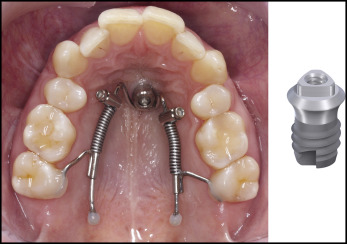
For this retrospective study, all available records of adult white patients with a sandblasted and acid-etched titanium palatal implant (Orthosystem Ortho implant; Institut Straumann, Basel, Switzerland) were screened from the research database of the Clinic of Orthodontics and Paediatric Dentistry, Centre of Dental Medicine, University of Zurich in Switzerland. The palatal implants were needed as anchorage devices for regular orthodontic treatment in all patients ( Fig 1 ). Inclusion criteria were the availability of 2 lateral cephalograms of good quality depicting (1) the same palatal implant at defined times during treatment (T1 and T2), (2) a clearly visible profile, and (3) lips in a relaxed closed position. T1 was defined as before treatment, with no orthodontic appliances but with the palatal implant in situ; T2 was after active treatment and debonding with the palatal implant still in situ. According to the internal standard protocol of the dental school, lateral cephalograms at T1 were taken after implant insertion to check for root proximity, relationship to the nasal floor, and angulation. Conforming to this protocol, all patients received final records including a lateral cephalogram after their active treatment and removal of the orthodontic appliances. Lateral cephalograms at T2 were only useful for this study if the implant was still present when the final records were taken. This was the case in many patients because the surgical removal was carried out in another clinic. Even though failures of rough-surfaced palatal implants after loading are rare, it was verified that no implant had been replaced between T1 and T2. By carefully assessing the pairs of cephalograms at T1 and T2 and comparing them with the profile photographs, it was verified that the lips were in a relaxed position. Patients with their lips strongly or unnaturally pressed together or with an artificial lip separation at T1 or T2 were excluded.
To ensure cessation of growth at T1, the patients had to be over 20 years of age. Minimum chronologic ages of 16 years for female subjects and 18 years for male subjects were also acceptable if residual growth could be excluded by hand and wrist radiography evaluation according to the method of Greulich and Pyle. No exclusion criteria were defined for any type of initial orthodontic malocclusion or orthodontic treatment plan with the exception of orthognathic surgery.
The inclusion criteria were fulfilled by 47 subjects (8 male, 39 female; mean age at T1, 24.5 years; range, 16.1-53.8 years). Angle classifications were determined using dental casts in combination with intraoral photographs. The following malocclusions were found at T1: 17 patients with Class I (16 female, 1 male), 28 patients with Class II (22 female, 2 male), and 2 patients with Class III (1 female, 1 male). Mean overjet was 4.79 mm (female subjects, 4.72 mm; male subjects, 4.38 mm). Mean overbite was 3.80 mm (female subjects, 3.86 mm; male subjects, 3.50 mm); 21 patients had a deepbite (≥4.5 mm), and 1 patient had an open bite (≤0 mm).
National authority confirmed that no ethical approval was necessary because the study was purely retrospective, and no additional palatal implants or lateral cephalograms were made. All patients had given their informed consent for secondary use of their data, which were irreversibly anonymized by a staff member not further involved in the study and only then given to the investigators, to comply with national law.
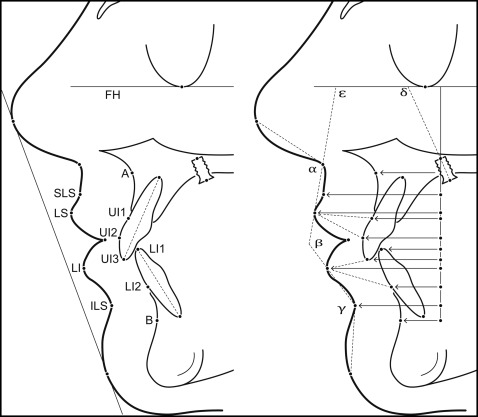
All lateral cephalograms were taken with a custom-made x-ray device (COMET, Flamatt, Switzerland) with the head held in a standardized position with ear rods and a nose rack, and the Frankfort horizontal parallel to the ground. The patients were asked to bite in centric occlusion and hold the lips in a lightly closed position. The focus-to-coronal plane distance was set at 200 cm, and the film-to-coronal plane distance was 15 cm; the enlargement was 7.5%. All cephalograms were hand-traced on acetate paper by the same investigator (M.K.). The palatal implants were used as fixed references for the superimposition of the cephalograms. A Cartesian coordinate system was defined with the Frankfort horizontal (at T1) as the x-axis, and the y-axis was registered through the upper central point of the palatal implant, as shown in Figure 2 . Soft tissue landmarks were defined according to the method of Burstone and are shown in Figure 2 . Additionally, standard cephalometric measurements were evaluated.
All tracings were digitized using a tablet digitizer (AccuGrid; Numonics, Montgomeryville, Pa) with a resolution of 0.0254 mm and analyzed with custom-written software (G.M.). All distances, angles, and the correction for magnification were performed using Excel 2010 software (version 14.0.6112.5000; Microsoft, Redmond, Wash) after digitization.
Statistical analysis
The statistical analyses were performed using Stata software (version 13.0/SE for Windows; StataCorp, College Station, Tex). To determine repeatability, intraclass correlation coefficients with 95% confidence intervals (CIs) for all measurements were calculated for 10 randomly selected patients. Both cephalograms (T1 and T2), including the accuracy of superimposition, were reassessed by the same investigator (M.K.) 2 months later. Descriptive statistics were calculated for all measurements at T1 and T2, and for the changes during treatment.
The primary null hypothesis included 2 parts, each tested at an alpha level of α = 0.025. One part was that the changes of the upper lip landmarks are not linearly correlated with the anteroposterior changes of the maxillary incisors, whereas the other was that changes of the lower lip landmarks are not linearly correlated with the anteroposterior changes of the maxillary and mandibular incisors. Consequently, the overall alpha level of the primary hypothesis for both lips was α = 0.05. The first primary hypothesis was tested with univariate ordinary least squares (OLS) regressions. The primary outcome measure was the change of the horizontal distance to the labrale superior. The second segment of the primary hypothesis was tested with multivariate OLS models with the distance to the labrale inferior as the primary outcome measure for the profile changes of the lower lip.
The secondary hypotheses were tested for correlations between horizontal changes of the inferior and superior labial sulci as outcomes and various positional changes of the mandibular and maxillary incisors as explanatory variables. Univariate OLS regression models were used to test for correlations between lip profile changes and variables describing lip thickness, skeletal divergence, maxillary incisor inclination, lip angles, and SNA, SNB, and ANB angles.
Every regression model was followed by regression diagnostics; P values, t statistics, correlation coefficients, and the standard deviations of the independent variables were reported. If the model assumption of homoscedasticity was violated, transformations of the dependent variables or the White-Huber sandwich estimator for robust standard errors was used. P values less than 0.05 were considered statistically significant.
Results
Repeatability judged in terms of intraclass correlation coefficient values ranged from 0.96 (95% CI, 0.914-0.986) to 0.99 (95% CI, 0.997-0.999) and showed a high level of reproducibility for all measurements and a low error of the method. Mean ages were 24.5 years (range, 16.1-53.8) at T1 and 27.0 years (range, 18.5-56.3) at T2. The mean ages for the female subjects were 23.1 years (range, 16.1-38.8) at T1 and 25.6 years (range, 18.5-40.8) at T2. For male subjects, the mean ages were 31.2 years (range, 19.1-53.8) at T1 and 33.7 years (range, 21.5-56.3) at T2. The mean time interval between T1 and T2 was 2.6 years (range, 1.2-5.0). The measurements at T1 and the changes during treatment of hard and soft tissue are shown in Table I . Overjet and overbite were checked for normality with the Kolmogorov-Smirnov test, and normal distributions were found at T1.
| T1 | T2 | T2-T1 | ||||||
|---|---|---|---|---|---|---|---|---|
| Mean | SD | Mean | SD | Mean | SD | Minimum | Maximum | |
| Hard tissue measurements | ||||||||
| SNA (°) | 80.49 | 2.95 | 79.89 | 3.12 | −0.54 | 1.01 | −3.17 | 1.27 |
| SNB (°) | 77.23 | 2.85 | 76.83 | 3.04 | −0.45 | 0.73 | −2.02 | 1.30 |
| ANB (°) | 3.26 | 2.54 | 3.15 | 2.69 | −0.09 | 1.05 | −3.23 | 2.14 |
| SpaSpp/MGo (°) | 26.62 | 5.60 | 26.91 | 5.74 | 0.34 | 1.32 | −3.97 | 3.94 |
| SN/MGo (°) | 33.76 | 5.57 | 34.09 | 5.62 | 0.36 | 1.26 | −3.98 | 2.75 |
| hUI1 (mm) | 15.44 | 2.95 | 13.51 | 3.30 | −1.93 | 1.89 | −5.95 | 1.12 |
| hUI2 (mm) | 16.99 | 3.43 | 14.70 | 3.54 | −2.28 | 2.36 | −8.16 | 1.95 |
| hUI3 (mm) | 15.24 | 4.11 | 12.96 | 4.15 | −2.30 | 3.07 | −9.71 | 3.31 |
| hLI1 (mm) | 10.94 | 3.64 | 10.62 | 3.75 | −0.34 | 1.89 | −4.54 | 2.89 |
| hLI2 (mm) | 10.14 | 3.59 | 9.38 | 4.17 | −0.67 | 1.63 | −4.49 | 2.30 |
| +1/FH (°) | 109.66 | 8.92 | 106.96 | 8.70 | −2.65 | 9.12 | −20.56 | 18.92 |
| +1/SpaSpp (°) | 108.10 | 8.81 | 105.49 | 7.75 | −2.61 | 9.10 | −20.71 | 19.07 |
| −1/FH (°) | 63.12 | 8.49 | 59.87 | 7.87 | −3.25 | 5.30 | −13.32 | 8.99 |
| −1/MGo (°) | 91.82 | 7.53 | 94.66 | 7.31 | 2.88 | 5.22 | −8.09 | 12.69 |
| +1/−1 (°) | 133.46 | 13.06 | 132.85 | 9.32 | −0.60 | 11.29 | −25.23 | 25.10 |
| Soft tissue measurements | ||||||||
| hSLS (mm) | 26.08 | 3.29 | 24.91 | 3.53 | −1.22 | 1.38 | −5.87 | 0.98 |
| hLS (mm) | 28.10 | 3.60 | 26.51 | 3.96 | −1.61 | 1.65 | −6.08 | 0.80 |
| hLI (mm) | 24.76 | 3.97 | 23.51 | 4.60 | −1.20 | 2.04 | −5.98 | 2.92 |
| hILS (mm) | 16.54 | 4.40 | 16.06 | 4.86 | −0.50 | 1.15 | −3.02 | 2.76 |
| Thickness of upper and lower lips | ||||||||
| ULT1 (mm) | 11.53 | 2.14 | 12.13 | 2.02 | 0.56 | 1.20 | −1.70 | 3.53 |
| ULT2 (mm) | 13.24 | 2.03 | 13.49 | 1.85 | 0.31 | 1.34 | −3.00 | 3.14 |
| LLT1 (mm) | 14.95 | 1.76 | 14.38 | 1.45 | −0.60 | 1.34 | −3.92 | 2.44 |
| LLT2 (mm) | 11.41 | 2.22 | 12.40 | 1.57 | 0.96 | 1.46 | −2.48 | 3.91 |
| Lip configuration angles | ||||||||
| Beta (°) | 133.13 | 14.55 | 142.62 | 13.68 | 9.55 | 12.56 | −7.80 | 56.99 |
| Epsilon (°) | 90.07 | 7.84 | 86.66 | 8.51 | −3.38 | 4.45 | −14.50 | 3.90 |
| Gamma (°) | 128.42 | 12.57 | 134.77 | 10.87 | 6.27 | 11.29 | −8.22 | 50.58 |
Univariate OLS regression models showed highly significant positive correlations between horizontal changes of the maxillary incisors in all 3 selected points and the horizontal reactions of the upper lip at the labrale superior with correlation coefficients between 0.44 and 0.66 ( Table II ). The most significant correlation of those landmarks was found between changes of the most anterior point of the maxillary incisor and changes of the labrale superior with a correlation coefficient of 0.59 ( Fig 3 ). The mean movement of the most anterior point of the maxillary incisor between T1 and T2 was −2.3 mm, ranging from a maximum protrusion of 1.94 mm to a maximum retrusion of −8.2 mm.
| Horizontal changes of lip measurements (T2-T1) | Horizontal changes of incisor measurements (T2-T1) | Correlation coefficient | SD of SE | P value |
|---|---|---|---|---|
| hLS | hUI1 | 0.66 | 0.08 | <0.001 ∗ |
| hUI2 | 0.59 | 0.06 | <0.001 ∗ | |
| hUI3 | 0.44 | 0.05 | <0.001 ∗ | |
| hSLS | hUI1 | 0.52 | 0.08 | <0.001 ∗ |
| hUI2 | 0.46 | 0.05 | <0.001 ∗ | |
| hUI3 | 0.35 | 0.04 | <0.001 ∗ | |
| hLI | hUI1 | 0.84 | 0.10 | <0.001 ∗ |
| hUI2 | 0.69 | 0.08 | <0.001 ∗ | |
| hUI3 | 0.51 | 0.06 | <0.001 ∗ | |
| hILS | hLI1 | 0.35 | 0.08 | <0.001 ∗ |
| hLI2 | 0.44 | 0.08 | <0.001 ∗ |
Stay updated, free dental videos. Join our Telegram channel
VIDEdental - Online dental courses


