Introduction
The aim of this study was to assess the effects of 3 luting agents (glass ionomer cement, compomer, and polycarboxylate cement) on white spot lesion formation in patients with full-coverage bonded acrylic splint expanders. White spot lesion formation was assessed with quantitative light-induced fluorescence.
Methods
Full-coverage rapid maxillary expanders were cemented with glass ionomer cement, compomer, and polycarboxylate cement in groups 1, 2, and 3, respectively. A control group comprised patients who never had orthodontic treatment. Quantitative light-induced fluorescence images taken before and after rapid maxillary expansion treatment were analyzed for these parameters: the percentages of fluorescence loss with respect to the fluorescence of sound tooth tissue (ΔF) and maximum loss of fluorescence intensity in the whole lesion; lesion area with ΔF equal to less than a −5% threshold; and the percentage of fluorescence loss with respect to the fluorescence of sound tissue times the area that indicated lesion volume.
Results
All 3 groups showed statistically significantly greater demineralization than the control group. The 3 experimental groups differed from each other in half of the parameters calculated. Teeth in the polycarboxylate group developed the most white spot lesions.
Conclusions
With the highest rate of white spot lesion formation, polycarboxylate cements should not be used for full-coverage bonded acrylic splint expanders. Compomers may be preferred over glass ionomer cements, based on the findings of this study.
Highlights
- •
Full-coverage acrylic splint rapid maxillary expanders were applied to patients.
- •
Three luting cements were used for cementation of the appliances.
- •
The quantitative light-induced fluorescence method was used for detection of the white spot lesions.
- •
Different levels of white spot lesion formation were observed in all cement groups.
Fixed orthodontic appliances are an indispensable part of orthodontic treatment. Different types of luting agents are used to attach fixed appliances such as brackets, bands, cast splint Herbst, and full-coverage bonded acrylic splint expanders to teeth. Various cements have been developed over the years with the desire to find a better material for clinical use.
Since its introduction as a dental material in the late 1960s by Smith, zinc polycarboxylate cement has been used widely for various clinical purposes, including cementation of fixed orthodontic appliances. Although it has the advantage of chemically bonding to tooth surfaces and metal surface oxides, disadvantages such as solubility in oral fluids, low tensile strength, short working span, poor bonding strength to enamel, and high viscosity have led to the search for new materials.
Glass ionomer cements (GICs) were introduced by Wilson and Kent in 1972. They provide chemical adhesion to enamel and stainless steel, and they release fluoride ions, thus protecting the enamel from demineralization. Today, conventional GIC is often the first choice in orthodontics for cementing molar bands. Nevertheless, GICs demonstrate low mechanical resistance and are susceptible to humidity during the initial setting reaction, resulting in weaker bond strengths than composite resins. These weaknesses led to ongoing efforts to improve the characteristics of the material, and polyacid-modified composite resin, also known as compomer, was developed. Combining the properties of composite resins and GICs, compomers are fluoride-releasing, light-cured materials that bond to tooth surfaces by mechanical interlock. Their physical and mechanical properties are more similar to those of composite resins than GICs.
A fixed appliance often cemented to the teeth is the rapid maxillary expander. In patients with maxillary deficiency, rapid maxillary expansion (RME) is often used to enhance the transverse maxillary dimensions at the skeletal, alveolar, and dental levels. The full-coverage bonded acrylic splint expander is one of many types of RME devices, and it is beneficial for its effect of preventing the unwanted tipping and extrusion of the maxillary posterior teeth that can occur during expansion. However, it often promotes increased plaque accumulation, and microleakage may occur through cementation failure.
It was previously indicated that patients who underwent RME treatment with a full-coverage bonded acrylic splint expander tended to develop more white spot lesions than did the control subjects. White spot lesion formation is a common side effect of orthodontic treatment, with a prevalence of 49.6% in patients who received fixed orthodontic treatment. Fixed appliances form plaque-retentive sites on the teeth, and maintaining adequate oral hygiene becomes difficult for the patient. Increased plaque accumulation results in increased cariogenic activity on surfaces that are not likely to develop caries ordinarily. As a result, white spot lesion formation, the first clinical sign of initial enamel demineralization, occurs. Early detection of these lesions is important because some lesions persist or even progress after the debonding of fixed appliances. Quantitative light-induced fluorescence (QLF) is a useful method of detecting white spot lesions; it can be used to evaluate changes in fluorescence levels of the lesions. White spot lesions show up as dark areas in the QLF images, where fluorescence loss is related to the reduction of mineralization levels of the enamel.
To date, several studies have investigated the effects of different luting agents used for bonding and banding on microleakage and demineralization. However, no studies have been performed to analyze the effects of different cements used with the full-coverage bonded acrylic splint expander on white spot lesion development.
Thus, the aims of this in-vivo study were to assess the effects of different types of cements used for the cementation of full-coverage bonded acrylic splint expanders on white spot lesion formation using QLF and to determine which one was more secure to use with bonded appliances.
Material and methods
Ethical approval was granted by local research ethics committee of Erciyes University, Kayseri, Turkey. A total of 47 patients treated at its Department of Orthodontics, Faculty of Dentistry, were included in the experimental groups of this study. The inclusion criteria for the experimental groups were posterior crossbite with transverse maxillary deficiency, good general health, no craniofacial anomalies, no previous orthodontic treatment, and no deciduous, congenitally missing, or extracted teeth. An informed consent was signed by the patients and the parents of those under 18 years of age before the study. The patients were randomly assigned to 3 groups. The first group included 16 patients (6 boys, 10 girls) with a mean age of 14.1 ± 2.2 years. The second group consisted of 16 patients (8 boys, 8 girls) with a mean age of 14.4 ± 1.9 years. The third group comprised 15 patients (6 boys, 9 girls), whose mean age was 13.9 ± 1.2 years. A power analysis was performed using G*Power software (version 3.0.10; Franz Faul Universitat, Kiel, Germany). Based on a 1:1 ratio between the groups, a sample size of 15 subjects in each group was calculated to give more than 85% power to detect significant differences with an effect size of 0.30 at a significance level of α = 0.05.
The patients in all 3 groups received RME using a full-coverage bonded acrylic splint expander that contained a hyrax screw (Dentaurum, Pforzheim, Germany) as the initial part of comprehensive orthodontic therapy ( Fig 1 ). The expanders were cemented to the teeth with glass ionomer luting cement (Ketac Cem Radiopaque; 3M ESPE, Neuss, Germany), compomer cement (R&D Series Nova Compomer Flow; Imicryl, Konya, Turkey), and polycarboxylate cement (Adhesor Carbofine; SpofaDental, Markova, Czech Republic) in accordance with the manufacturer’s instructions in groups 1, 2, and 3, respectively. The patients were told to beware of hard foods and acidic beverages to prevent bond breakdown after cementation. Brushing instructions with the appliance in situ were given to all patients at the start of the treatment, and they were told to brush their teeth after each meal. No additional fluoride supplements or preventive methods were given.
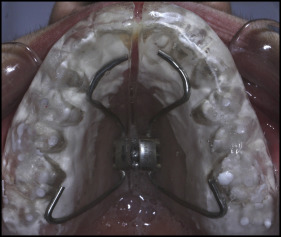
The full-coverage bonded acrylic splint expanders covered the palate and entire tooth surfaces except for a 1-mm line between its edges and the gingival margins. This gap was set for the patient to provide efficient hygiene at the gingival margins. The hyrax screws were activated by 2 quarter turns per day (0.2 mm per turn) for the first week and 1 quarter turn per day after the first week until the desired amounts of expansion were reached in all groups. The expansion was completed when the tips of the palatal cusps of the maxillary first molars contacted the tips of the buccal cusps of the mandibular first molars. The appliance was left in the mouth for an additional month after the active expansion phase as a fixed retainer. Appliances were kept cemented in situ for 65.10 ± 3.06, 66.5 ± 3.7, and 65.91 ± 2.18 days for groups 1, 2, and 3, respectively.
Group 4 consisted of 17 untreated control subjects (9 boys, 8 girls) with a mean age of 20.7 ± 1.1 years. They also had no missing teeth and were told to use the same oral hygiene procedures as did the other groups.
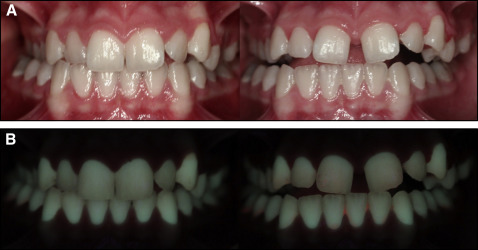
QLF images were captured before (T0) and after (T1) appliance cementation by the same examiner (Y.N.K.) in a dark room using a QLF-D Biluminator 2-camera system (Inspektor Research Systems, Amsterdam, The Netherlands), which was connected to a computer with image-capturing software (C3 v1.20, Inspektor Research Systems) ( Fig 2 ). Images of the tooth surfaces were always captured using the same camera position and angulation. The T0 and T1 images of the control group comprised QLF images taken 3 months apart.
The images were analyzed for white spot lesion formation with analysis software (QA2 v1.20; Inspektor Research Systems) by an investigator (Y.N.K.) who was blinded to the groups. These parameters were calculated for the buccal surfaces of 10 anterior teeth (maxillary incisors, canines, and premolars): the percentages of fluorescence loss with respect to the fluorescence of sound tooth tissue (ΔF) and maximum loss of fluorescence intensity in the whole lesion (ΔFmax); lesion area with ΔF equal to or less than a −5% threshold (A); and the percentage of fluorescence loss with respect to the fluorescence of sound tissue times the area that indicated lesion volume (ΔQ). The calculations were repeated after a 2-week interval by the same examiner. Correlation coefficients for measurements were found to be high, with a value of 0.89 for intraobserver reliability.
Statistical analysis
The Shapiro-Wilk normality test was applied to the data, which did not show a normal distribution. For the intragroup comparisons of the parameters at T0 and T1, the Wilcoxon signed rank test was used for each group. The Kruskal-Wallis test was used to compare the differences between the measurements at the beginning and end of the study of the groups. The Mann-Whitney U test was used for post hoc comparisons, and the Bonferroni correction was applied. Statistical significance was set at P <0.05 (version 15.0; SPSS, Chicago, Ill).
Results
The mean ΔF, ΔFmax, A, ΔQ scores, and P values of the 160 buccal surfaces of 16 patients in the GIC group are given in Table I . Fluorescence loss was observed in all teeth except the maxillary right and left canines and right second premolars in the GIC group, showing demineralization of the enamel.
| Tooth | ΔF (%), mean T0 | ΔF (%), mean T1 | ΔF (%), P value | ΔFmax (%), mean T0 | ΔFmax (%), mean T1 | ΔFmax (%), P value | ΔQ (%px 2 ), mean T0 | ΔQ (%px 2 ), mean T1 | ΔQ (%px 2 ), P value | A (px 2 ), mean T0 | A (px 2 ), mean T1 | A (px 2 ), P value |
|---|---|---|---|---|---|---|---|---|---|---|---|---|
| 11 | −1.51 ± 2.71 | −4.35 ± 4.37 | 0.004 † | −1.56 ± 2.8 | −5.75 ± 6.11 | 0.004 † | −5.18 ± 10.04 | −50.12 ± 77.94 | 0.004 † | 0.87 ± 1.74 | 6.5 ± 10.62 | 0.02 ∗ |
| 12 | −4.15 ± 4.05 | −6.97 ± 5.55 | 0.004 † | −5.87 ± 6.79 | −13 ± 11.37 | 0.001 † | −177.18 ± 491.09 | −610.25 ± 1146.44 | 0.003 † | 18.12 ± 47.29 | 51.62 ± 91.48 | 0.006 † |
| 13 | −4.07 ± 9.62 | −4.84 ± 10.07 | 0.297NS | −8.06 ± 22.02 | −9.18 ± 23.17 | 0.469NS | −479.56 ± 1506.11 | −450.56 ± 1619.5 | 0.469NS | 21.18 ± 53.75 | 16.25 ± 40.5 | 0.578NS |
| 14 | −2.53 ± 3.96 | −6.75 ± 3.95 | 0.002 † | −5 ± 8.63 | −11.75 ± 11.23 | 0.01 ∗ | −247.06 ± 518.87 | −315.81 ± 556.72 | 0.11NS | 27.37 ± 55.25 | 24.43 ± 46.8 | 0.497NS |
| 15 | −2.51 ± 4.11 | −4.56 ± 5.29 | 0.055NS | −4.75 ± 9.39 | −7.25 ± 11.18 | 0.164NS | −311 ± 1096.43 | −335.18 ± 791.25 | 0.129NS | 27.12 ± 91.79 | 31.62 ± 71.36 | 0.129NS |
| 21 | −3.13 ± 4.42 | −5.42 ± 5 | 0.002 † | −4.81 ± 7.47 | −9.37 ± 11.75 | 0.002 † | −253.5 ± 634.16 | −1070.5 ± 2963.21 | 0.006 † | 25.87 ± 64.55 | 79.37 ± 200.06 | 0.01 ∗ |
| 22 | −2.2 ± 3.44 | −4.61 ± 4.42 | 0.008 † | −3 ± 4.93 | −7.87 ± 8.95 | 0.004 † | −104.37 ± 349.88 | −197.87 ± 357.92 | 0.03 * | 12.18 ± 38.62 | 22.68 ± 38.96 | 0.164NS |
| 23 | −2.2 ± 6.05 | −4.23 ± 7.34 | 0.063NS | −5.12 ± 14.04 | −7.5 ± 14.3 | 0.313NS | −1060.62 ± 3419.68 | −2360.3 ± 9157.37 | 0.313NS | 57.37 ± 179.78 | 92.25 ± 342.09 | 0.313NS |
| 24 | −0.85 ± 2.32 | −3.6 ± 3.84 | 0.02 ∗ | −1.43 ± 4.25 | −4.87 ± 5.73 | 0.03 ∗ | −24.81 ± 97.37 | −73.37 ± 175.25 | 0.008 † | 3.5 ± 13.73 | 8.81 ± 20.58 | 0.008 † |
| 25 | −1.08 ± 3.01 | −5.64 ± 4.63 | <0.001 ‡ | −1.56 ± 4.57 | −8.43 ± 9.14 | <0.001 ‡ | −6.62 ± 23.03 | −187.62 ± 367.43 | <0.001 ‡ | 0.68 ± 2.27 | 17.75 ± 33.45 | <0.001 ‡ |
Table II shows the scores of each parameter and the P values in the compomer group. From a total of 160 buccal surfaces that were assessed, decreases in the fluorescence levels were observed in half of the evaluated teeth: central and lateral incisors and second premolars on the right side and first and second premolars on the left side. These results indicated that half of the teeth were affected by mineral loss in the patients cemented with compomer.
| Tooth | ΔF (%), mean T0 | ΔF (%), mean T1 | ΔF (%), P value | ΔFmax (%), mean T0 | ΔFmax (%), mean T1 | ΔFmax (%), P value | ΔQ (%px 2 ), mean T0 | ΔQ (%px 2 ), mean T1 | ΔQ (%px 2 ), P value | A (px 2 ), mean T0 | A (px 2 ), mean T1 | A (px 2 ) P value |
|---|---|---|---|---|---|---|---|---|---|---|---|---|
| 11 | −3.93 ± 4.49 | −6.62 ± 7.15 | 0.005 † | −6.50 ± 9.72 | −11.50 ± 14.00 | 0.008† | −733.31 ± 2673.39 | −2165.25 ± 8085.89 | 0.022 ∗ | 56.50 ± 196.02 | 88.38 ± 297.58 | 0.110NS |
| 12 | −3.49 ± 3.72 | −5.71 ± 4.29 | 0.006 † | −5.31 ± 6.14 | −6.13 ± 9.73 | 0.119NS | −271.38 ± 642.92 | −387.38 ± 753.19 | 0.328NS | 113.44 ± 390.89 | 43.69 ± 81.36 | 0.424NS |
| 13 | −0.33 ± 1.30 | −0.85 ± 2.35 | 0.180NS | −0.31 ± 1.25 | −1.19 ± 3.49 | 0.180NS | −0.31 ± 1.25 | −67.25 ± 267.40 | 0.180NS | 0.63 ± 0.25 | 8.69 ± 34.48 | 0.317NS |
| 14 | −1.49 ± 2.71 | −3.32 ± 4.03 | 0.180NS | −1.75 ± 3.47 | −5.19 ± 7.1 | 0.180NS | −12.00 ± 38.13 | −38.06 ± 66.54 | 0.180NS | 1.75 ± 5.25 | 4.50 ± 7.24 | 0.034 ∗ |
| 15 | −2.58 ± 4.12 | −5.07 ± 4.44 | 0.028 ∗ | −4.38 ± 7.50 | −8.88 ± 10.70 | 0.016 ∗ | −43.38 ± 81.18 | −151.00 ± 265.99 | 0.037 ∗ | 5.00 ± 8.92 | 15.56 ± 25.11 | 0.032 ∗ |
| 21 | −3.83 ± 5.57 | −5.56 ± 7.29 | 0.093NS | −6.63 ± 5.57 | −10.63 ± 16.14 | 0.049 ∗ | −2086.06 ± 7889.28 | −2420.50 ± 8386.60 | 0.017 ∗ | 113.44 ± 390.89 | 120.13 ± 375.90 | 0.271NS |
| 22 | −4.00 ± 4.43 | −5.53 ± 6.09 | 0.066NS | −7.31 ± 8.99 | −11.13 ± 14.94 | 0.093 ∗ | −419 ± 86 ± 816.07 | −468.13 ± 907.09 | 0.859NS | 42.75 ± 72.52 | 34.38 ± 54.64 | 0.594NS |
| 23 | −1.30 ± 2.83 | −2.08 ± 3.32 | 0.136NS | −1.63 ± 3.61 | −2.69 ± 4.61 | 0.136NS | −10.44 ± 31.84 | −23.50 ± 61.33 | 0.138NS | 1.44 ± 4.27 | 3.06 ± 7.65 | 0.078NS |
| 24 | −0.51 ± 2.83 | −3.88 ± 4.41 | 0.017 ∗ | −1.63 ± 3.61 | −5.50 ± 7.03 | 0.027 ∗ | −24.50 ± 75.61 | −55.56 ± 127.85 | 0.123NS | 3.56 ± 10.56 | 6.50 ± 13.34 | 0.123NS |
| 25 | −2.34 ± 3.78 | −4.08 ± 5.12 | 0.028 ∗ | −4.13 ± 8.25 | −7.69 ± 11.65 | 0.018 ∗ | −83.25 ± 261.43 | −295.88 ± 636.98 | 0.018 ∗ | 9.06 ± 25.79 | 25.63 ± 48.94 | 0.018 ∗ |
The values of the third group, polycarboxylate, are displayed in Table III . From the 150 analyzed buccal surfaces in this group, more teeth affected by white spot lesion formation were identified. The left canine was the only tooth that was not statistically significantly affected in terms of all measured parameters.
| Tooth | ΔF (%), mean T0 | ΔF (%), mean T1 | ΔF (%), P value | ΔFmax (%), mean T0 | ΔFmax (%), mean T1 | ΔFmax (%), P value | ΔQ (%px 2 ), mean T0 | ΔQ (%px 2 ), mean T1 | ΔQ (%px 2 ), P value | A (px 2 ), mean T0 | A (px 2 ), mean T1 | A (px 2 ), P value |
|---|---|---|---|---|---|---|---|---|---|---|---|---|
| 11 | −0.85 ± 2.25 | −5.77 ± 4.81 | 0.005 † | 1.00 ± 2.65 | −8.67 ± 7.84 | 0.005 † | −7.27 ± 20.54 | −146.40 ± 292.64 | 0.005 † | 1.20 ± 3.51 | 15.80 ± 26.91 | 0.008 ∗ |
| 12 | −3.01 ± 3.42 | −6.58 ± 4.03 | 0.002 † | −4.20 ± 5.28 | −11.13 ± 9.16 | 0.002 ∗ | −58.40 ± 145.53 | −458.60 ± 949.93 | 0.010 ∗ | 7.73 ± 17.29 | 43.33 ± 84.08 | 0.015 ∗ |
| 13 | 0.0 ± 0.00 | −3.49 ± 4.20 | 0.018 ∗ | 0.0 ± 0.00 | −4.53 ± 5.85 | 0.018 ∗ | 0.0 ± 0.00 | −32.27 ± 54.68 | 0.018 ∗ | 0.0 ± 0.00 | 4.00 ± 6.55 | 0.018 ∗ |
| 14 | −1.13 ± 2.35 | −5.80 ± 5.00 | 0.005 † | −1.13 ± 2.39 | −8.40 ± 9.37 | 0.005 † | −11.67 ± 37.00 | −134.60 ± 280.89 | 0.017 ∗ | 1.87 ± 5.72 | 12.00 ± 20.26 | 0.019 ∗ |
| 15 | −2.14 ± 4.30 | −6.09 ± 6.73 | 0.013 ∗ | −3.20 ± 8.04 | −10.60 ± 15.45 | 0.009 † | −30.87 ± 113.51 | −1014.80 ± 3331.22 | 0.007 † | 2.20 ± 7.44 | 50.00 ± 146.32 | 0.007 † |
| 21 | −0.81 ± 2.15 | −5.26 ± 3.60 | 0.003 † | −0.87 ± 2.29 | −6.80 ± 5.99 | 0.003 † | −2.13 ± 6.78 | −378.20 ± 1219.92 | 0.003 † | 0.33 ± 1.05 | 37.53 ± 114.17 | 0.003 † |
| 22 | −2.87 ± 3.84 | −5.93 ± 4.75 | 0.005 † | −4.07 ± 6.22 | −7.60 ± 12.20 | 0.074NS | −214.20 ± 729.765 | −751.40 ± 1525.22 | 0.007 † | 20.67 ± 65.86 | 66.67 ± 115.70 | 0.012 ∗ |
| 23 | −0.47 ± 1.83 | −1.01 ± 2.73 | 0.180NS | −0.67 ± 2.58 | −1.33 ± 3.83 | 0.180NS | −7.07 ± 27.37 | −9.53 ± 35.30 | 0.180NS | 1.00 ± 3.87 | 1.07 ± 3.86 | 0.317NS |
| 24 | −1.40 ± 3.06 | −6.65 ± 3.91 | 0.002 † | −2.20 ± 5.62 | −9.73 ± 6.93 | 0.002 † | −41.53 ± 147.14 | −181.67 ± 249.41 | 0.002 † | 4.40 ± 14.67 | 19.67 ± 25.37 | 0.002 † |
| 25 | −3.12 ± 6.06 | −7.65 ± 5.98 | 0.002 † | −5.60 ± 13.92 | −12.27 ± 13.53 | 0.002 † | −185.67 ± 661.18 | −314.53 ± 911.41 | 0.015 ∗ | 9.67 ± 29.40 | 18.33 ± 39.29 | 0.019 ∗ |
Table IV displays the values of each parameter in the control group. There were no statistically significant changes, showing that no new white spot lesions occurred between the 3 months when the images were taken.
| Tooth | ΔF (%), mean T0 | ΔF (%), mean T1 | ΔF (%), P value | ΔFmax (%), mean T0 | ΔFmax (%), mean T1 | ΔFmax (%), P value | ΔQ (%px 2 ), mean T0 | ΔQ (%px 2 ), mean T1 | ΔQ (%px 2 ), P value | A (px 2 ), mean T0 | A (px 2 ), mean T1 | A (px 2 ), P value |
|---|---|---|---|---|---|---|---|---|---|---|---|---|
| 11 | −1.81 ± 3.42 | −2.44 ± 3.56 | 0.313NS | −2.76 ± 5.67 | −3.94 ± 7.32 | 0.125NS | −26.58 ± 63.58 | −95.05 ± 293.23 | 0.156NS | 3.23 ± 7.08 | 10.41 ± 28.91 | 0.156NS |
| 12 | 0 ± 0 | −0.99 ± 2.23 | 0.25NS | 0 ± 0 | −1 ± 2.26 | 0.25NS | 0 ± 0 | −2.29 ± 5.21 | 0.25NS | 0 ± 0 | 0.41 ± 0.93 | 0.25NS |
| 13 | −0.37 ± 1.55 | −0.99 ± 2.21 | 0.5NS | −0.35 ± 1.45 | −1.23 ± 2.77 | 0.25NS | −0.35 ± 1.45 | −11.76 ± 34.67 | 0.25NS | 0.05 ± 0.24 | 2.05 ± 6.06 | 0.25NS |
| 14 | −0.92 ± 2.77 | −0.77 ± 2.17 | 1NS | −1.35 ± 4.28 | −1 ± 2.87 | 1NS | −22.47 ± 83.59 | −6.76 ± 24.96 | 0.5NS | 2.35 ± 8.07 | 1 ± 3.64 | 0.5NS |
| 15 | −0.41 ± 1.72 | −0.84 ± 2.41 | 0.5NS | −0.47 ± 1.94 | −1.58 ± 5.03 | 0.5NS | −2.05 ± 8.48 | −37.17 ± 145.97 | 0.5NS | 0.29 ± 1.21 | 4.52 ± 17.42 | 0.5NS |
| 21 | −1.82 ± 2.94 | −2.8 ± 3.1 | 0.156NS | −2.29 ± 3.82 | −3.47 ± 3.97 | 0.109NS | −22.52 ± 75.1 | −44.52 ± 99.75 | 0.148NS | 3.23 ± 10.35 | 6.58 ± 13.16 | 0.148NS |
| 22 | −1.51 ± 2.82 | −1.86 ± 3 | 0.438NS | −1.82 ± 3.46 | −2.47 ± 4.15 | 0.313NS | −5.58 ± 12.89 | −40.76 ± 103.47 | 0.125NS | 0.82 ± 1.84 | 6.11 ± 14.96 | 0.125NS |
| 23 | −0.29 ± 1.21 | −0.32 ± 1.35 | 1NS | −0.29 ± 1.21 | −0.35 ± 1.45 | 1NS | −0.58 ± 2.42 | −1.29 ± 5.33 | 1NS | 0.11 ± 0.48 | 0.23 ± 0.97 | 1NS |
| 24 | −1.69 ± 6.98 | −1.9 ± 7.85 | 1NS | −4.35 ± 17.94 | −4.64 ± 19.16 | 1NS | −957.88 ± 3949.45 | −1075.82 ± 4435.73 | 1NS | 33.29 ± 137.27 | 33.17 ± 136.79 | 1NS |
| 25 | −1.37 ± 4.5 | −1.88 ± 3.08 | 0.625NS | −2.58 ± 9.46 | −2.29 ± 3.94 | 0.625NS | −73.35 ± 295.8 | −22.58 ± 52.73 | 0.625NS | 4.23 ± 16.21 | 3.41 ± 8.19 | 0.625NS |
The differences between T0 and T1 in the groups were statistically compared, and the results of the comparisons among the 4 groups, as well as the post hoc comparisons between each group, are given in Table V . The differences between fluorescence levels of the enamel were found to be statistically significantly different between the groups in most teeth, except for the maxillary left and right canines and the right second premolars. This result indicates that demineralization levels between the groups were significantly different from each other. Post hoc comparisons showed that most of the statistically significant changes were between the polycarboxylate and control groups. The second-most number of significant changes was found between the GIC and control groups.
| Parameter | Tooth | GIC | Compomer | Polycarboxylate | Control | P | Post hoc (Mann-Whitney U test) | |||||
|---|---|---|---|---|---|---|---|---|---|---|---|---|
| ΔF (%) | 11 | −2.84 ± 3.66 | −2.69 ± 3.66 | −4.93 ± 4.58 | −0.64 ± 1.82 | 0.003 ‡ | 0.984 | 0.179 | 0.145 | 0.009 | 0.007 ∗ | 0.001 ∗ |
| 12 | −2.82 ± 3.35 | −2.21 ± 2.85 | −3.57 ± 3.95 | −0.99 ± 2.23 | 0.024 † | 0.619 | 0.590 | 0.273 | 0.015 | 0.072 | 0.002 ∗ | |
| 13 | −0.77 ± 3.03 | −0.53 ± 1.95 | −3.49 ± 4.14 | −0.62 ± 1.88 | 0.060 | 0.635 | 0.120 | 0.030 | 0.507 | 0.644 | 0.014 | |
| 14 | −4.23 ± 4.41 | −1.83 ± 2.59 | −4.67 ± 5.01 | 0.15 ± 0.92 | 0.001 ‡ | 0.147 | 0.795 | 0.074 | 0.002* | 0.007 ∗ | <0.001 ∗ | |
| 15 | −2.05 ± 3.97 | −2.49 ± 3.75 | −3.95 ± 5.84 | −0.42 ± 1.45 | 0.124 | 0.953 | 0.214 | 0.241 | 0.176 | 0.296 | 0.010 | |
| 21 | −2.29 ± 2.93 | −1.73 ± 4.37 | −4.45 ± 3.36 | −0.97 ± 2.17 | 0.010 † | 0.306 | 0.153 | 0.031 | 0.037 | 0.409 | 0.002 ∗ | |
| 22 | −2.41 ± 3.93 | −1.53 ± 3.00 | −3.05 ± 3.38 | −0.35 ± 1.49 | 0.043 † | 0.450 | 0.345 | 0.099 | 0.072 | 0.289 | 0.005 ∗ | |
| 23 | −2.03 ± 3.61 | −0.78 ± 2.15 | −0.54 ± 1.62 | −0.04 ± 0.15 | 0.451 | 0.436 | 0.355 | 0.726 | 0.144 | 0.309 | 0.433 | |
| 24 | −2.76 ± 4.35 | −3.37 ± 4.56 | −5.25 ± 3.93 | −0.21 ± 0.87 | 0.001 ‡ | 0.889 | 0.070 | 0.089 | 0.015 | 0.035 | <0.001 ∗ | |
| 25 | −4.56 ± 4.18 | −1.73 ± 2.92 | −4.53 ± 0.97 | −0.51 ± 3.38 | 0.001 ‡ | 0.026 | 0.750 | 0.010 | 0.004 ∗ | 0.531 | 0.001 ∗ | |
| ΔFmax (%) | 11 | 4.19 ± 4.82 | −5.00 ± 5.49 | −7.67 ± 7.19 | −1.18 ± 2.43 | 0.018 † | 0.693 | 0.148 | 0.262 | 0.035 | 0.027 | 0.004 ∗ |
| 12 | −7.13 ± 7.21 | −0.81 ± 11.02 | −6.93 ± 8.75 | −1.00 ± 2.26 | 0.003 ‡ | 0.039 | 0.563 | 0.174 | 0.001* | 0.279 | 0.001 ∗ | |
| 13 | −1.13 ± 4.87 | −0.88 ± 3.24 | −4.53 ± 5.85 | −0.88 ± 2.18 | 0.120 | 0.635 | 0.136 | 0.034 | 0.773 | 0.686 | 0.048 | |
| 14 | −6.75 ± 9.57 | −3.44 ± 4.55 | −7.27 ± 9.36 | 0.35 ± 1.73 | 0.003 ‡ | 0.320 | 0.904 | 0.152 | 0.006 ∗ | 0.006 ∗ | <0.001 ∗ | |
| 15 | −2.50 ± 9.85 | −4.50 ± 7.02 | −7.40 ± 12.45 | −1.12 ± 3.28 | 0.158 | 0.545 | 0.214 | 0.641 | 0.255 | 0.117 | 0.020 | |
| 21 | −4.56 ± 5.70 | −4.00 ± 7.62 | −5.93 ± 4.99 | −1.18 ± 2.67 | 0.026 † | 0.430 | 0.331 | 0.142 | 0.030 | 0.306 | 0.003 ∗ | |
| 22 | −4.88 ± 8.23 | −3.81 ± 10.03 | −3.53 ± 15.03 | −0.65 ± 2.52 | 0.089 | 0.449 | 0.527 | 0.258 | 0.034 | 0.253 | 0.022 | |
| 23 | −2.38 ± 6.87 | −1.06 ± 2.86 | −0.67 ± 1.80 | −0.06 ± 0.24 | 0.441 | 0.519 | 0.316 | 0.646 | 0.144 | 0.284 | 0.433 | |
| 24 | −3.44 ± 6.19 | −3.88 ± 6.55 | −7.53 ± 5.90 | −0.29 ± 1.21 | 0.002 ‡ | 0.919 | 0.050 | 0.036 | 0.084 | 0.069 | <0.001 ∗ | |
| 25 | −6.88 ± 8.44 | −3.56 ± 5.14 | −6.67 ± 6.45 | 0.29 ± 7.07 | 0.005 ‡ | 0.221 | 0.646 | 0.073 | 0.004 ∗ | 0.122 | 0.001 ∗ | |
| ΔQ (%px 2 ) | 11 | −44.94 ± 76.12 | −1431.94 ± 5418.63 | −139.13 ± 286.35 | −68.47 ± 236.26 | 0.250 | 1.000 | 0.415 | 0.492 | 0.135 | 0.333 | 0.042 |
| 12 | −433.06 ± 984.05 | −116.00 ± 549.13 | −400.20 ± 865.41 | −2.29 ± 5.22 | 0.023 † | 0.151 | 0.858 | 0.169 | 0.008 | 0.548 | 0.003 ∗ | |
| 13 | 29.00 ± 436.32 | −66.94 ± 267.48 | −32.27 ± 54.68 | −11.41 ± 33.33 | 0.271 | 0.635 | 0.489 | 0.043 | 0.658 | 0.686 | 0.094 | |
| 14 | −68.75 ± 539.71 | −26.06 ± 44.38 | −122.93 ± 278.71 | 15.71 ± 58.63 | 0.002 ‡ | 0.126 | 0.473 | 0.384 | 0.002 ∗ | 0.002 ∗ | 0.001* | |
| 15 | −24.19 ± 1342.66 | −107.63 ± 208.77 | −983.93 ± 3322.70 | −35.12 ± 137.50 | 0.111 | 0.800 | 0.823 | 0.968 | 0.056 | 0.027 | 0.027 | |
| 21 | −817.00 ± 2377.91 | −334.44 ± 851.31 | −376.07 ± 1213.37 | −22.00 ± 108.61 | 0.494 | 0.753 | 0.673 | 0.427 | 0.344 | 0.461 | 0.122 | |
| 22 | −93.50 ± 189.96 | −48.25 ± 784.33 | −537.20 ± 933.06 | −35.18 ± 100.96 | 0.096 | 0.279 | 0.214 | 0.048 | 0.215 | 0.810 | 0.035 | |
| 23 | −1299.69 ± 5899.82 | −13.06 ± 32.39 | −2.47 ± 8.04 | −0.71 ± 2.91 | 0.467 | 0.673 | 0.329 | 0.571 | 0.144 | 0.284 | 0.478 | |
| 24 | −48.56 ± 99.34 | −31.06 ± 142.34 | −140.13 ± 192.46 | −117.94 ± 486.28 | 0.002 ‡ | 0.811 | 0.051 | 0.031 | 0.034 | 0.066 | <0.001 ∗ | |
| 25 | −181.00 ± 367.39 | −212.63 ± 415.24 | −128.87 ± 272.24 | 50.76 ± 270.04 | 0.040 † | 0.528 | 0.590 | 0.463 | 0.012 | 0.087 | 0.010 | |
| A (px 2 ) | 11 | 5.63 ± 10.46 | 31.88 ± 103.45 | 14.60 ± 26.29 | 7.18 ± 23.09 | 0.508 | 0.937 | 0.392 | 0.489 | 0.345 | 0.568 | 0.130 |
| 12 | 33.50 ± 81.67 | 10.44 ± 62.64 | 35.60 ± 72.50 | 0.41 ± 0.94 | 0.083 | 0.256 | 0.841 | 0.264 | 0.016 | 0.548 | 0.017 | |
| 13 | −4.94 ± 41.17 | 8.63 ± 34.50 | 4.00 ± 6.55 | 2.00 ± 5.84 | 0.193 | 0.472 | 0.411 | 0.021 | 0.757 | 0.374 | 0.113 | |
| 14 | −2.94 ± 48 ± 53 | 2.75 ± 5.11 | 10.13 ± 19.47 | −1.35 ± 4.46 | 0.011 † | 0.253 | 0.936 | 0.245 | 0.014 | 0.014 | 0.001* | |
| 15 | 4.50 ± 113.74 | 10.56 ± 20.35 | 47.80 ± 145.12 | 4.24 ± 16.22 | 0.122 | 0.922 | 0.760 | 0.968 | 0.059 | 0.033 | 0.027 | |
| 21 | 53.50 ± 139.51 | 6.69 ± 45.24 | 37.20 ± 113.17 | 3.35 ± 13.84 | 0.282 | 0.243 | 0.570 | 0.074 | 0.455 | 0.623 | 0.170 | |
| 22 | 10.50 ± 24.58 | −8.38 ± 60.05 | 46.00 ± 73.74 | 5.29 ± 14.55 | 0.054 | 0.174 | 0.148 | 0.018 | 0.522 | 0.298 | 0.043 | |
| 23 | 34.88 ± 176.84 | 1.63 ± 3.76 | 0.07 ± 0.26 | 0.12 ± 0.49 | 0.349 | 0.640 | 0.177 | 0.330 | 0.144 | 0.284 | 0.964 | |
| 24 | 5.31 ± 9.58 | 2.94 ± 16.01 | 15.27 ± 23.18 | −0.12 ± 0.49 | <0.00 § | 0.765 | 0.064 | 0.041 | 0.005 ∗ | 0.012 | <0.00* | |
| 25 | 17.06 ± 33.35 | 16.56 ± 32.40 | 8.67 ± 15.54 | −0.82 ± 14.69 | 0.047 † | 0.476 | 0.547 | 0.381 | 0.016 | 0.112 | 0.012 | |
Stay updated, free dental videos. Join our Telegram channel
VIDEdental - Online dental courses


