Introduction
The purpose of this research was to analyze craniofacial morphology and adolescent facial growth in subjects with Pierre Robin sequence (PRS). The research was conducted at the Center for Craniofacial Care and Research at The Hospital for Sick Children, Toronto, Ontario, Canada, and the Burlington Facial Growth Research Center, Faculty of Dentistry, University of Toronto.
Methods
Longitudinal lateral cephalometric tracings of 34 Caucasian subjects with nonsyndromic PRS were compared with those of unaffected control subjects, matched for age, sex, and ethnicity, and representing the range of occlusions in an untreated population. Cephalometric measurements were obtained before orthodontic treatment (age, 11.8 years) and after orthodontic treatment but before any surgical treatment (age, 16.6 years). Between-group differences of craniofacial measurements were analyzed with paired t -tests, and longitudinal growth differences were analyzed with analysis of variance (ANOVA) adjusted for the growth interval.
Results
Significant differences were noted, with the PRS group showing smaller cranial base length, shorter maxillary and mandibular lengths, increased palatal and mandibular plane inclinations, and more open mandibular flexure. Mandibular body length and height were smaller as were ramal length and width, anterior basal thickness, and chin thickness. The ramus-to-body ratio was greater. With growth, greater gains in anterior face and symphyseal height were seen, but the mandible showed less closure of its internal flexure. The maxilla and the mandible remained retrusive during adolescent growth, and the maxilla became more retrognathic. Mandibular morphologic differences persisted in spite of additionally adjusting for cranial base length in the analysis.
Conclusions
Subjects with PRS had reduced cranial base and maxillary and mandibular lengths. Mandibular deficiency was most pronounced in the body. Due to bimaxillary retrognathism, the maxillomandibular dysplasia was not significant. A vertical growth pattern worsened the profile. There was no evidence of adolescent mandibular catch-up growth.
Pierre Robin sequence (PRS) is a craniofacial anomaly characterized by the triad of mandibular micrognathia, cleft palate, and severe upper airway obstruction all occurring at birth. Named after the French stomatologist Pierre Robin, who in 1923 and 1934 described multiple severe problems associated with micrognathia in the neonatal period. PRS has a reported prevalence between 1 in 8500 and 1 in 20,000 births. PRS has been described to be causally heterogeneous and pathogenetically and phenotypically variable. Mandibular micrognathia in PRS can be malformational, when due to intrinsic hypoplasia, or deformational, when due to intrauterine constraint. Micrognathia and glossoptosis can cause severe airway obstruction with feeding difficulties in the neonate; these can be fatal. Depending on the severity of airway compromise, various interventions can be required in the early management of an infant born with PRS. The literature reports conservative approaches such as prone positioning to more aggressive management techniques with head braces or suspension caps, mandibular advancement and traction appliances, nasopharyngeal intubation, and surgical interventions such as tongue-lip adhesion (glossopexy), tracheostomy, and mandibular distraction osteogenesis.
Contrary to the earlier popular view that mandibular micrognathia in PRS is an effect of intrauterine constriction and that growth would catch up to normal, recent research has not shown significant catch-up growth. The current view is that the mandible is small at birth and remains small throughout active facial growth, and catch-up growth is only partial, leaving patients with PRS retrognathic and significantly convex in adulthood. A detailed analysis of the mandibular morphology and its longitudinal growth compared with a matched control group of subjects has not been reported in the literature. The aims of this study were to analyze the craniofacial features and mandibular morphology in patients with PRS compared with an age- and sex-matched sample of unaffected normal control subjects, and to evaluate longitudinal growth differences during adolescence.
Material and methods
The sample consisted of Caucasian children with nonsyndromic PRS treated at the Center for Craniofacial Care and Research, The Hospital for Sick Children, Toronto, for whom longitudinal cephalometric radiographs were available. Children with other craniofacial anomalies in addition to PRS and other syndromes, and those who were not Caucasian, were excluded from the study. A diagnosis of PRS had been made for the patients based on cleft palate at birth, mandibular micrognathia, and at least 1 episode of respiratory distress in the neonatal period. Because of causal, pathogenetic, and phenotypic differences, PRS and Robin complex of various types can occur. PRS is also known to occur with other craniofacial syndromes. Because of the participation of experts from several disciplines in the craniofacial care of patients at the center, it was possible to select records of only subjects with PRS who did not have an associated syndrome. Due to the relatively low frequency of PRS, the sample included patients who had received treatment at the center at various times. All patients had received their palatal repair surgeries at the center. Surgical treatment had entailed palate repair between 15 and 24 months of age by any of the 4 surgeons who were a part of the team at the time of their surgeries. The most common surgical palate repair techniques included von Langenbeck and push-back palatoplasty. No secondary or revisionary palate surgical procedures were undertaken, and 1 patient had received a superiorly based pharyngeal flap. Two time points were selected for this study: T1, toward the end of the transitional dentition period or just when the patient entered the permanent dentition stage of dental development, but before any orthodontic interventions; and T2, after completion of orthodontic treatment (but before orthognathic surgery if it was planned). These times were selected to approximate the prepubertal growth status and completion of active mandibular growth. No patient had received aggressive or surgical neonatal intervention. There were 34 children with PRS who fulfilled the inclusion criteria (the PRS group). For each child with PRS, an age- and sex-matched subject was selected from the normative cephalometric collection of Caucasian patients at the Burlington Facial Growth Research Center, Faculty of Dentistry, University of Toronto. To compare the craniofacial features in PRS with a control sample representing the unaffected population, it was determined to include the range of occlusions that would be found in an untreated population. Therefore, the control sample comprised 34 unaffected normal children who had received no orthodontic treatment. We selected 24 age- and sex-matched control subjects with Class I occlusion, 8 with Class II occlusion, and 2 with Class III occlusion (the control group). Normative cephalometric data were collected from films available at the ages most closely approximating those at T1 and T2 of the PRS group. Details of the PRS and control groups are presented in Table I .
| PRS group (n = 34) | Control group (n = 34) | |||||
|---|---|---|---|---|---|---|
| Mean | SD | Range | Mean | SD | Range | |
| T1 | 11.7 | 0.7 | 10.2-13.0 | 11.9 | 0.8 | 10.0-13.0 |
| T2 | 16.6 | 1.2 | 14.3-18.2 | 16.7 | 1.4 | 14.0-20.0 |
| Boys (n = 13) | Girls (n = 21) | Boys (n = 13) | Girls (n = 21) | |||||||||
|---|---|---|---|---|---|---|---|---|---|---|---|---|
| Mean | SD | Range | Mean | SD | Range | Mean | SD | Range | Mean | SD | Range | |
| T1 | 11.8 | 0.9 | 10.2-13.0 | 11.6 | 0.6 | 10.6-12.7 | 11.8 | 1.0 | 10.0-13.1 | 12.0 | 0.6 | 11.0-13.0 |
| T2 | 15.9 | 1.2 | 14.6-18.1 | 16.9 | 1.2 | 14.3-18.2 | 16.3 | 1.1 | 14.0-18.2 | 16.9 | 1.5 | 14.1-20.0 |
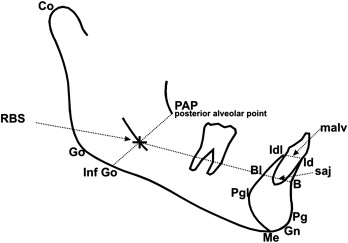
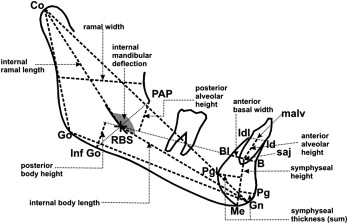
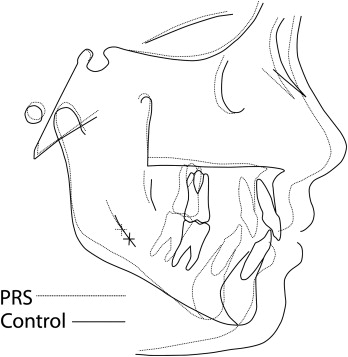
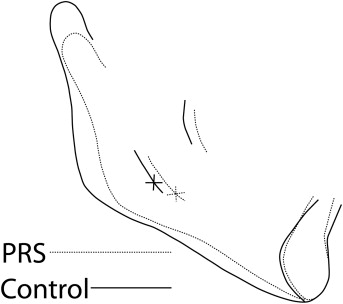
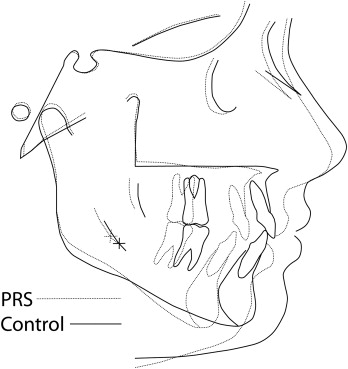
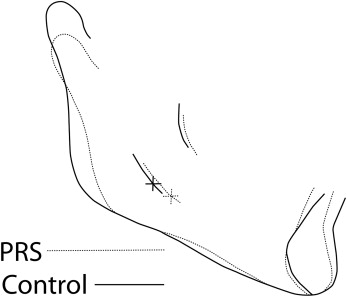
All cephalograms used in this study had been taken with a standardized technique and apparatus. The cephalograms were traced, and 103 landmarks were digitized for each cephalogram by 1 technician using Dentofacial Planner cephalometric software (Dentofacial Software, Toronto, Ontario, Canada). The cephalometric analysis used was a composite of measurements from conventional analyses, with additional landmarks and measurements defined to study the mandibular morphology in detail ( Figs 1 and 2 ) . An internal, geometrically constructed point, ramus body syncline (RBS), was defined as the point of intersection of the midplaned cortical outline of the mandibular nerve with a line drawn from the most posteroinferior midplaned point on the anterior border of the ascending ramus (posterior alveolar point, PAP) to a midplaned point on the lower border of the mandible where the convexity at gonion merges with the concavity of the antegonial notch (inferior gonion, Inf Go) ( Fig 1 ). RBS differentiates the internal ramal and body components of the mandible. A central axis of the symphysis, which measured the symphyseal height, was drawn from the midpoint of the basilar portion of the anterior mandible (the symphysis alveolar junction, saj), to menton (Me), whereas the axis from saj to the midpoint of the anterior alveolus (malv) measured the anterior alveolar height. RBS in conjunction with PAP, saj, malv, Inf Go, and Me allowed measurements of internal ramal length, internal body length, posterior and anterior mandibular alveolar heights, posterior mandibular body height, and symphyseal height and angular measurements such as internal mandibular deflection and mandibular /symphyseal deflection. With the Dentofacial Planner software, the average tracings of the PRS group were superimposed on those of the control group at T1 ( Figs 3 and 4 ) and T2 ( Figs 5 and 6 ) . To assess intraexaminer repeatability, radiographs of 13 randomly selected subjects from each group (26 subjects) were retraced and redigitized. Repeatability was assessed through linear and angular measurements recorded during both the observations, correlated by the intraclass correlation coefficient. The highly significant agreement of measurements recorded from the repeated tracings demonstrated excellent repeatability of the cephalometric method ( Table II ).
| First tracing | Second tracing | ||||||
|---|---|---|---|---|---|---|---|
| Measurement | Mean | SD | Mean | SD | Intraexaminer measurement error ∗ | Intraexaminer ICCC | P value |
| S-N (mm) | 70.68 | 3.49 | 70.72 | 3.45 | 0.03 | 0.995 | <0.0001 |
| Ba-S (mm) | 45.36 | 2.91 | 45.31 | 2.87 | 0.02 | 0.998 | <0.0001 |
| Ba-N (mm) | 105.30 | 5.05 | 105.35 | 4.99 | 0.03 | 0.998 | <0.0001 |
| Cranial base angle (S-N/Ba-S) (°) | 129.30 | 5.41 | 129.42 | 5.51 | 0.03 | 0.998 | <0.0001 |
| S-N/maxillary plane (°) | 9.89 | 3.91 | 9.99 | 3.89 | 0.03 | 0.997 | <0.0001 |
| S-N/Go-Gn (°) | 35.34 | 7.30 | 35.48 | 7.23 | 0.03 | 0.999 | <0.0001 |
| Ba-N/Co-Gn (°) | 77.00 | 5.43 | 77.23 | 5.30 | 0.04 | 0.997 | <0.0001 |
| N-Me (mm) | 114.17 | 7.14 | 113.96 | 7.37 | 0.08 | 0.993 | <0.0001 |
| N-ANS (mm) | 52.19 | 3.49 | 52.22 | 3.47 | 0.02 | 0.998 | <0.0001 |
| ANS-Me (mm) | 66.92 | 6.00 | 66.94 | 6.17 | 0.04 | 0.998 | <0.0001 |
| S-Go (mm) | 71.85 | 5.54 | 71.91 | 5.52 | 0.03 | 0.998 | <0.0001 |
| Maxillary length (mm) | 51.07 | 4.76 | 51.29 | 4.74 | 0.04 | 0.998 | <0.0001 |
| Co-A (mm) | 87.44 | 5.78 | 87.32 | 5.63 | 0.03 | 0.998 | <0.0001 |
| Co-Gn (mm) | 110.14 | 6.61 | 110.25 | 6.57 | 0.04 | 0.998 | <0.0001 |
| SNA (°) | 79.64 | 3.76 | 79.57 | 3.79 | 0.02 | 0.998 | <0.0001 |
| SNB (°) | 75.30 | 4.10 | 75.29 | 4.13 | 0.02 | 0.999 | <0.0001 |
| ANB (°) | 4.35 | 3.06 | 4.28 | 3.10 | 0.02 | 0.998 | <0.0001 |
| Wits appraisal (mm) | 3.58 | 3.90 | 3.64 | 3.85 | 0.04 | 0.994 | <0.0001 |
| Co-Go (mm) | 52.53 | 3.94 | 52.78 | 3.95 | 0.05 | 0.993 | <0.0001 |
| Go-Gn (mm) | 70.33 | 6.34 | 70.31 | 6.16 | 0.05 | 0.996 | <0.0001 |
| Internal ramal length (mm) | 57.32 | 3.62 | 57.48 | 3.54 | 0.04 | 0.995 | <0.0001 |
| Internal body length (mm) | 55.54 | 4.79 | 55.52 | 4.75 | 0.04 | 0.997 | <0.0001 |
| Ramal width (mm) | 32.75 | 3.23 | 32.57 | 3.09 | 0.04 | 0.991 | <0.0001 |
| Posterior mandibular alveolar height (mm) | 14.13 | 2.07 | 14.20 | 2.02 | 0.03 | 0.987 | <0.0001 |
| Posterior mandibular body height (mm) | 10.42 | 1.64 | 10.36 | 1.67 | 0.03 | 0.984 | <0.0001 |
| Anterior mandibular alveolar height (mm) | 9.95 | 2.39 | 9.91 | 2.30 | 0.04 | 0.987 | <0.0001 |
| Anterior mandibular basal width (mm) | 9.38 | 1.57 | 9.27 | 1.58 | 0.02 | 0.991 | <0.0001 |
| Sagittal symphyseal height (mm) | 21.33 | 2.64 | 21.23 | 2.72 | 0.05 | 0.982 | <0.0001 |
| Symphyseal thickness (mm) | 14.40 | 1.91 | 14.36 | 1.87 | 0.04 | 0.988 | <0.0001 |
| Internal mandibular deflection (°) | 155.72 | 5.84 | 155.52 | 5.89 | 0.07 | 0.994 | <0.0001 |
| Gonial angle (°) | 130.22 | 6.86 | 129.88 | 6.85 | 0.07 | 0.996 | <0.0001 |
| Mandibular/symphysis deflection (°) | 68.30 | 6.34 | 68.40 | 6.43 | 0.09 | 0.989 | <0.0001 |
∗ Method error = √ Σ D2/2N, where D is the difference in the repeated measurements, and N is the number of double measurements.
Statistical analysis
The cephalometric data recorded were analyzed by using paired t tests to evaluate the differences at the 2 times with the Statistical Package for Social Sciences software (version 15, SPSS, Chicago, Ill), and the differences of growth increments in linear and angular measurements from T1 to T2 for each group were analyzed with analysis of variance (ANOVA) adjusted for the duration from T1 to T2 with Minitab 14 statistical software (Minitab, State College, Pa). The mandibular measurements were further analyzed with 2-way ANOVA at each time point, adjusted for age, sex, and the measurement of the cranial base (represented by Ba-N) to eliminate any bias created by differences in basic stature or overall craniofacial size causing overrepresentation of the mandibular measurement differences.
Results
The descriptive measurements (unadjusted) for both the PRS and the control groups and the paired t -tests at both times are summarized in Table III , and the results of the analysis for growth from T1 to T2 with the ANOVA adjusted for the duration of growth interval are provided in Table IV . Results of the ANOVA for mandibular measurements at T1 and T2, adjusted for age, sex, and cranial base length are summarized in Table V .
| Comparison at T1 | Comparison at T2 | |||||||||||
|---|---|---|---|---|---|---|---|---|---|---|---|---|
| PRS group | Control group | PRS group | Control group | Paired | ||||||||
| (n = 34) | (n = 34) | Difference | Paired t-test | (n = 34) | (n = 34) | Difference | t-test | |||||
| Measurement | Mean | SD | Mean | SD | (control – PRS) | P value | Mean | SD | Mean | SD | (control – PRS) | P value |
| S-N (mm) | 69.51 | 2.91 | 72.31 | 2.97 | 2.8 | <0.01 † | 72.33 | 3.35 | 75.12 | 3.32 | 2.79 | <0.01 † |
| Ba-S (mm) | 44.00 | 3.46 | 46.64 | 2.35 | 2.64 | <0.01 † | 46.87 | 3.98 | 49.07 | 3.09 | 2.20 | <0.01 † |
| Ba-N (mm) | 103.42 | 4.32 | 108.23 | 4.09 | 4.81 | <0.001 ‡ | 108.35 | 4.92 | 112.69 | 5.13 | 4.34 | <0.01 † |
| Cranial base angle (S-N/Ba-S) (°) | 130.17 | 4.52 | 129.94 | 4.99 | −0.23 | 0.83 | 129.79 | 4.78 | 129.36 | 5.34 | −0.43 | 0.71 |
| S-N/Go-Gn (°) | 39.94 | 6.76 | 30.99 | 4.20 | −8.95 | <0.001 ‡ | 38.88 | 7.08 | 28.96 | 4.61 | −9.92 | <0.001 ‡ |
| Ba-N/Co-Gn (°) | 79.39 | 4.22 | 73.31 | 3.21 | −6.08 | <0.001 ‡ | 80.08 | 4.7 | 73.06 | 3.48 | −7.02 | <0.001 ‡ |
| S-N/maxillary plane (°) | 12.83 | 3.86 | 8.94 | 3.44 | −3.89 | <0.001 ‡ | 12.77 | 3.72 | 9.02 | 3.60 | −3.75 | <0.001 ‡ |
| N-Me (mm) | 112.07 | 7.98 | 114.22 | 5.17 | 2.15 | 0.16 | 122.07 | 8.70 | 121.09 | 7.79 | −0.98 | 0.59 |
| N-ANS (mm) | 51.80 | 3.33 | 52.81 | 2.80 | 1.01 | 0.22 | 55.94 | 3.68 | 55.67 | 3.22 | −0.27 | 0.75 |
| ANS-Me (mm) | 66.13 | 6.56 | 65.47 | 4.11 | −0.66 | 0.58 | 71.98 | 7.79 | 69.44 | 5.50 | −2.54 | 0.09 |
| S-Go (mm) | 68.24 | 6.04 | 73.84 | 4.70 | 5.60 | <0.001 ‡ | 76.3 | 6.70 | 80.9 | 7.29 | 4.60 | <0.01 † |
| S-Go:N-Me (%) | 59.11 | 4.59 | 63.47 | 3.63 | 4.36 | <0.001 ‡ | 60.78 | 4.84 | 69.49 | 4.40 | 8.71 | <0.001 ‡ |
| Maxillary length (mm) | 48.04 | 4.04 | 54.66 | 3.17 | 6.62 | <0.001 ‡ | 50.77 | 4.63 | 57.99 | 3.02 | 7.22 | <0.001 ‡ |
| Co-A (mm) | 83.64 | 5.06 | 90.59 | 3.67 | 6.95 | <0.001 ‡ | 88.21 | 5.41 | 95.31 | 4.81 | 7.10 | <0.001 ‡ |
| Co-Gn (mm) | 105.78 | 6.23 | 114.11 | 4.81 | 8.33 | <0.001 ‡ | 116.16 | 6.53 | 123.17 | 6.87 | 7.01 | <0.001 ‡ |
| Maxillomandibular differential (mm) | 22.13 | 4.69 | 23.52 | 3.67 | 1.39 | 0.13 | 27.96 | 5.58 | 27.87 | 4.41 | −0.09 | 0.96 |
| SNA (°) | 76.53 | 3.75 | 81.28 | 3.09 | 4.75 | <0.001 ‡ | 76.38 | 4.1 | 82.07 | 3.20 | 5.69 | <0.001 ‡ |
| SNB (°) | 72.16 | 3.92 | 78.06 | 2.72 | 5.90 | <0.001 ‡ | 73.08 | 3.90 | 79.55 | 2.75 | 6.47 | <0.001 ‡ |
| ANB (°) | 4.39 | 2.97 | 3.22 | 1.78 | −1.17 | 0.06 | 3.30 | 3.36 | 2.51 | 1.94 | −0.79 | 0.28 |
| Wits appraisal (mm) | 3.53 | 3.54 | 1.96 | 1.60 | −1.57 | <0.05 ∗ | 3.93 | 4.16 | 2.40 | 1.74 | −1.53 | 0.06 |
| A-N perpendicular (mm) | −6.48 | 4.42 | −1.77 | 3.20 | 4.71 | <0.001 ‡ | −7.21 | 4.42 | −1.01 | 3.53 | 6.20 | <0.001 ‡ |
| Pg-N perpendicular (mm) | −18.73 | 7.88 | −8.03 | 5.04 | 10.70 | <0.001 ‡ | −17.58 | 8.91 | −4.73 | 5.25 | 12.85 | <0.001 ‡ |
| Internal ramal length (mm) | 55.36 | 3.91 | 58.59 | 2.98 | 3.23 | <0.001 ‡ | 61.66 | 4.07 | 64.45 | 4.20 | 2.79 | <0.01 † |
| Internal body length (mm) | 52.09 | 3.84 | 58.97 | 3.49 | 6.88 | <0.001 ‡ | 56.69 | 4.45 | 63.29 | 4.27 | 6.60 | <0.001 ‡ |
| Co-Go (mm) | 50.36 | 4.66 | 53.92 | 3.45 | 3.56 | <0.001 ‡ | 57.13 | 4.87 | 59.89 | 5.23 | 2.76 | <0.01 † |
| Go-Gn (mm) | 65.22 | 4.33 | 75.00 | 3.54 | 9.78 | <0.001 ‡ | 70.82 | 4.99 | 80.99 | 5.29 | 10.17 | <0.001 ‡ |
| Ramus/body ratio (internal) | 106.63 | 8.37 | 99.6 | 6.31 | −7.03 | <0.01 † | 109.29 | 9.74 | 102.03 | 6.33 | −7.26 | <0.01 † |
| Ramus/body ratio (external) | 77.37 | 7.03 | 71.95 | 4.16 | 5.42 | <0.001 ‡ | 80.94 | 7.67 | 74.03 | 5.64 | −6.91 | <0.001 ‡ |
| Ramal width (mm) | 30.8 | 2.19 | 34.39 | 2.30 | 3.59 | <0.001 ‡ | 31.37 | 2.48 | 35.24 | 2.97 | 3.87 | <0.001 ‡ |
| Posterior mandibular alveolar height (mm) | 14.19 | 2.18 | 13.83 | 2.51 | −0.36 | 0.54 | 14.6 | 2.60 | 13.68 | 2.50 | −0.92 | 0.14 |
| Posterior mandibular body height (mm) | 9.56 | 1.67 | 11.59 | 1.86 | 2.03 | <0.001 ‡ | 11.16 | 2.32 | 12.38 | 3.35 | 1.22 | <0.05 ∗ |
| Anterior mandibular alveolar height (mm) | 10.57 | 2.32 | 9.58 | 0.54 | −0.99 | <0.05 ∗ | 11.31 | 2.44 | 10.09 | 1.77 | −1.22 | 0.01 ∗ |
| Anterior mandibular basal width (mm) | 8.90 | 1.56 | 9.66 | 1.31 | 0.76 | <0.05 ∗ | 7.69 | 1.48 | 9.15 | 1.56 | 1.46 | <0.001 † |
| Sagittal symphyseal height (mm) | 20.19 | 2.41 | 21.18 | 2.16 | 0.99 | 0.07 | 23.19 | 2.67 | 23.28 | 2.62 | 0.09 | 0.85 |
| Symphyseal thickness (mm) | 13.42 | 1.08 | 14.75 | 0.98 | 1.33 | <0.01 † | 13.96 | 1.20 | 15.54 | 1.17 | 1.58 | <0.01 † |
| Internal mandibular deflection (°) | 160.48 | 5.17 | 152.87 | 5.51 | −7.61 | <0.001 ‡ | 158.89 | 6.02 | 149.79 | 5.07 | −9.10 | <0.001 ‡ |
| Gonial angle (°) | 136.08 | 7.18 | 125.93 | 4.41 | −10.15 | <0.001 ‡ | 133.81 | 8.17 | 123.16 | 5.05 | −10.65 | <0.001 ‡ |
| Mandibular/symphysis deflection (°) | 65.89 | 6.59 | 68.35 | 6.29 | 2.46 | 0.63 | 63.79 | 6.49 | 68.17 | 5.97 | 4.38 | <0.01 † |
Stay updated, free dental videos. Join our Telegram channel
VIDEdental - Online dental courses


