Introduction
Rapid palatal expansion (RPE) is routinely used to correct transverse deficiencies in the maxilla, but its effects on the dentoalveolus are uncertain. The purpose of this study was to compare measurements made on cone-beam computerized tomography scans between patients with RPE treatment and controls to determine transverse dimension increases and the amounts of alveolar and dental tipping.
Methods
Twenty-five patients with posterior crossbite who required RPE treatment and 25 sex- and age-matched controls (no crossbite) were orthodontically treated and received cone-beam computerized tomography scans at the beginning and middle of treatment. Transverse widths and several angulations were measured, and matched paired t tests used.
Results
RPE treatment produced a significant increase in all measured transverse dimensions. Analysis of posttreatment angulation changes in the RPE group showed that the alveolus substantially tipped buccally by nearly 5.6° (measured from a horizontal reference, the base of the hard palate). The angulations of the dentition, however, remained constant before and after treatment (<1° of change) in both groups.
Conclusions
These data showed no statistically significant amount of relative dental tipping after RPE treatment but significant alveolar tipping compared with the controls.
Rapid palatal expansion (RPE) appliances have routinely been used to remedy transverse deficiencies in the maxilla since their conception in the 1900s. The effects of RPE on the dentoskeletal complex have been studied with dental casts and lateral and posteroanterior cephalograms. Recent advances in cone-beam computerized tomography (CBCT) 3-dimensional imaging enable the capture and reproduction of a real maxillary section in all 3 planes and hence allow measurement of axial inclinations of the dentition, and changes in the transverse dimensions and the magnitude of displacement of the maxillary halves free from distortion, magnification, and superimposition.
RPE treatment contributes to the increase in the maxillary arch by a combination of orthodontic (tipping and translation) and orthopedic (bony separation and remodeling at the suture) effects. Prior investigators noted transverse increases of 3.5 to 9.5 mm, with averages of 6.04 mm from posteroanterior cephalograms and 6.74 mm from casts. The resultant dental tipping ranged from 0° to 24° for both sides, with an average of 3.1° for 1 side.
The objective of this study was to compare the dimensional changes of skeletal and dental structures in a group of growing patients treated for maxillary constriction before and after RPE, with a matched control group, using CBCT 3-dimensional imaging. The study quantified the increase in the transverse dimensions of the maxilla’s postpalatal expansion therapy at various levels. We attempted to show the quantity and direction of alveolar and dental responses to the therapy and compare our findings with those reported in the literature.
Material and methods
Clinical treatment was rendered at the Advanced Orthodontic Clinic at the University of Southern California in Los Angeles. Twenty-five healthy patients (18 girls; mean age, 12.6 years, range, 8.8-15 years; and 7 boys; mean age, 13.2 years; range, 9.1- 15.8 years) who required RPE for unilateral or bilateral crossbite and orthodontic treatment and had CBCT imaging were selected for the study. Twenty-five controls (with no posterior crossbite), selected for similar age and sex (18 girls; mean age, 12.7 years; range, 8.6-14.7 years; and 7 boys; mean age, 13.2 years; range, 9.2-15.7 years), had orthodontic treatment only (no RPE) and also initial and midtreatment CBCT scans ( Table I ).
| RPE group | Control group | |
|---|---|---|
| Age (y) | 12.8 ± 1.84 | 12.8 ± 1.83 |
| Sex | 18 male, 7 female | 18 male, 7 female |
All scans were retrieved from the archives of the department’s NewTom 3G Volume Scanner CBCT unit (QR, Verona, Italy). Clinical judgment and the patients’ age were the key factors in determining that all patients were still growing, and that the treatment preceded the fusion of their midpalatal sutures. All patients were in the late transitional or early permanent dentition stage. They had no craniofacial abnormalities, or previous surgical or extraction treatment.
Patients treated with the RPE had a hyrax palatal expander banded on the maxillary first premolars and first molars. They were monitored weekly for appropriate activation of the appliance. They were advised to activate their appliance 1 or 2 times per day until the required expansion—ie, slight overcorrection of the crossbite defined as the palatal cusp of the maxillary first molar occluded with the buccal cusp of the mandibular first molar—was achieved (average time, 4-6 weeks). After this process, they were stabilized. The RPE (or a transpalatal arch) was used for retention for at least 3 months after expansion. Most patients with RPE had no orthodontic treatment until after the fixed retention period, but several had some appliances placed (such as a 2 × 4) during the fixed retention period. The control patients started orthodontic treatment at approximately the same time as the RPE group started expansion therapy. The scans of all patients were taken as part of beginning and progress records at the midpoint in treatment, which ranged from 11.5 to 24.5 months (average, 17.9 months) for the RPE patients and 11.0 to 30.6 months for the controls (average, 17.1 months). To test for differences in the time elapsed between scans, we conducted a paired t test and found no statistically significant difference between matched pairs of patients ( P = 0.441). The patients were asked to put their head in Frankfort horizontal position for the scans.
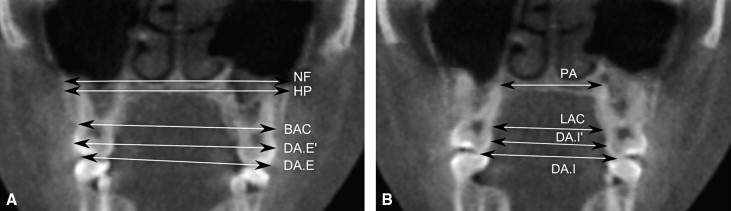
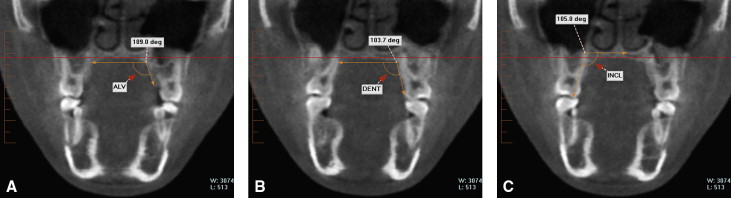
The scans were imported, and cross-sectional slices were made with InVivo dental software (Anatomage, San Jose, Calif). The slices were coronal bisections through the buccal grooves and the palatal roots of the maxillary first molars. Transverse measurements ( Fig 1 ) and angular measurements ( Fig 2 ) were recorded for each scan.
Identification of the dentoskeletal landmarks and subsequent measurements were manually performed by 1 investigator for both groups (A.K.). Twenty patients (10 RPE treated, 10 controls) were randomly selected, and their images were resliced and remeasured by the same examiner after a 60-day interval.
Statistical analysis
Descriptive statistics (means and standard deviations) were obtained for each measurement before and after treatment. To assess differences among the matched pairs between means of continuous variables, we used the paired t test with the significance level set at 5% and the Wilcoxon signed rank test for nonparametric paired samples. Histograms and Kolmorogov-Smirnov tests were used to check for normality of the variables.
To test the reliability of the measurements, 20 patients were randomly selected, and their images were remeasured by the same examiner after a 60-day interval. The difference between the duplicate measurements was analyzed by computing intraclass correlation coefficients; their means were 0.96 ± 0.017 for the angular measurements and 0.98 ± 0.012 for the transverse measurements; these represent highly reliable measurements.
Statistical analysis was carried out with SAS software (version 9.1, SAS Institute, Cary, NC) with a significance level of 0.05.
Results
A comparison of transverse measurements at baseline ( Table II ) showed that the RPE group significantly differed ( P <0.05) from the control group in almost all parameters. All but 3 transverse lengths were significantly greater for the control group before treatment, as expected. At the level of the hard palate, 3.84 mm of width difference was observed between the 2 groups, indicating the extent of transverse deficiency in the RPE group before treatment.
| Baseline parameter (mm) | RPE group Mean ± SD |
Control group Mean ± SD |
Paired t test, P value |
|---|---|---|---|
| NF | 64.85 ± 9.11 | 68.53 ± 5.08 | 0.118 |
| HP | 60.98 ± 6.96 | 64.82 ± 3.91 | 0.0295 |
| PA | 30.06 ± 3.63 | 32.80 ± 4.72 | 0.0211 |
| BAC | 57.21 ± 4.24 | 59.80 ± 3.76 | 0.0041 |
| DA.E | 51.13 ± 4.28 | 53.49 ± 3.43 | 0.013 |
| DA.E′ | 54.87 ± 4.14 | 57.46 ± 3.40 | 0.0064 |
| DA.I | 38.65 ± 4.03 | 40.28 ± 3.55 | 0.0868 |
| DA.I′ | 31.63 ± 3.67 | 33.26 ± 3.25 | 0.067 |
| LAC | 28.70 ± 3.29 | 32.49 ± 2.95 | <0.001 |
No significant differences between the 2 groups in dental angulation were seen at baseline ( Table III ). Significant differences were observed between the groups in the angulations between the alveolar bone ( P = 0.0002). The angle measured between the alveolus was about 8.65° more acute in the RPE group than in the control group.
| Baseline parameter (°) |
RPE group Mean ± SD |
Control group Mean ± SD |
Paired t test, P value |
|---|---|---|---|
| Alv | 108.13 ± 5.93 | 116.78 ± 6.54 | 0.0002 |
| Dent | 103.43 ± 6.26 | 101.55 ± 7.18 | 0.379 |
| Incl | 107.78 ± 6.11 | 105.69 ± 7.47 | 0.298 |
In the after-treatment characteristics in absolute transverse changes, the RPE group showed substantial increases in all parameters, with all differing significantly from the control group’s absolute changes. Increases of approximately 5 mm were seen at the dental level, with 2-mm increases at the skeletal level ( Table IV ).
| Changes in parameter (mm) | RPE group Mean ± SD |
Control group Mean ± SD |
Paired t test, P value |
|---|---|---|---|
| ▵ NF | 2.08 ± 5.66 | −0.85 ± 2.38 | 0.0155 |
| ▵ HP | 2.25 ± 3.57 | −0.12 ± 2.12 | 0.0023 |
| ▵ PA | 4.40 ± 2.69 | 0.03 ± 1.71 | <0.001 |
| ▵ BAC | 3.00 ± 2.35 | 0.09 ± 1.00 | <0.001 |
| ▵ DA.E | 5.35 ± 3.79 | 0.40 ± 1.69 | <0.001 |
| ▵ DA.E′ | 5.42 ± 3.02 | 0.29 ± 0.88 | <0.001 |
| ▵ DA.I | 4.56 ± 3.80 | −0.08 ± 2.26 | <0.001 |
| ▵ DA.I′ | 4.00 ± 2.77 | −0.19 ± 1.69 | <0.001 |
| ▵ LAC | 5.09 ± 3.04 | 0.02 ± 1.71 | <0.001 |
No significant absolute angulation changes were observed in the angulations of the dentition. However, the angle of the alveolus significantly increased on average by approximately 5° in the RPE group. These increases were statistically significant when compared with the controls. Whereas the RPE group’s anglulations increased, the control group’s angles decreased by an average of 2.84° ( Table V ).
| Change in parameter (°) | RPE group Mean ± SD |
Control group Mean ± SD |
Paired t test, P value |
|---|---|---|---|
| ▵ Alv | 5.61 ± 6.94 | −2.84 ± 7.09 | <0.0001 |
| ▵ Dent | −0.95 ± 4.98 | −0.88 ± 6.06 | 0.964 |
| ▵ Incl | −0.81 ± 6.47 | 0.32 ± 5.63 | 0.454 |
In the after-treatment comparison of transverse measurements, the base of the maxilla showed no significant difference between the RPE and control groups; however, although the widths of the RPE group appeared to approach those of the controls, they were still smaller ( Table VI ). No differences were seen in the alveolar structural measurements. Statistically significant differences were seen between the 2 groups in the widths of the dental structures (comparisons of transverse measurements). The dental crown widths of the RPE group were on average 2.5 mm larger than those of the control group.


