Introduction
This analysis aimed to assess quantitatively and qualitatively the compressive stress (S3) in periodontal ligament in a gradual periodontal breakdown (0-8 mm) under orthodontic movements. Correlations between the applied forces, the level of bone resorption, the decrease of force magnitude, and S3 increase were also conducted.
Methods
On the basis of cone-beam computed tomography examinations (voxel size, 0.075 mm), nine 3-dimensional models of the second mandibular premolar with intact periodontium were created and then individually subjected to various levels of horizontal bone loss. Orthodontic forces (intrusion: 0.2 N; extrusion, rotation, tipping: 0.6 N; translation: 1.2 N) were applied on the brackets. Finite elements analysis was performed, and S3 stresses were quantitatively and qualitatively determined.
Results
Translation and rotation induced the highest stress apically and cervically, whereas intrusion determined the lowest. Apical stress was lower than cervical stress. In intact periodontium, only intrusion and extrusion exhibited S3 stresses lower (apically and cervically) than maximum hydrostatic pressure (MHP) and maximum tolerable stress (MTS). In reduced periodontium, S3 stress (except for intrusion) exceeded MHP and MTS.
Conclusions
In reduced periodontium, forces of 0.2 N seems safe to be used. Forces of 0.6-1.2 N may produce stresses exceeding both MTS and MHP, endangering the periodontium. S3 failure criterion (despite its widely use) seems not to be adequate for accurate quantitative results when evaluating the stress in the periodontal ligament while remaining adequate for qualitative results. An overall correlation between the applied force, S3 increase, and periodontal breakdown applicable to all 5 movements could not be established—this was possible only for sole movements.
Highlights
- •
In reduced periodontium, translation and rotation induced the highest stress apically and cervically.
- •
In reduced periodontium (up to 8 mm bone loss), 0.2 N intrusion force was used safely.
- •
In reduced periodontium (0.6-1.2 N), the produced compressive stress exceeded maximum tolerable values (MTS and MHP).
In a reduced periodontium, orthodontic forces could produce regressive changes, circulatory disturbances, and further periodontal breakdown. Thus, periodontal ischemia (determined by the compression of tissues) seems to play a major part in inducing irreversible inflammatory pulpal reactions, regressive periodontal changes, and root resorption, especially in patients with reduced periodontium subjected to orthodontic treatment. , , In intact periodontium, the use of low orthodontic forces up to 1.2 N seems to reduce to a minimum the risk for circulatory disturbances not endangering periodontal tissues and pulp vitality. , , , , It is important to emphasize that a thorough periodontal examination, a correct diagnosis, and successful periodontal therapy with noninflamed periodontal tissues and physiological periodontal pockets are a prerequisite before any orthodontic treatment. Moreover, after the initiation of orthodontic therapy, patients must be thoroughly instructed on maintaining optimal oral hygiene, and regular check-ups based on their individual risk should be considered. There seems to be no consensus regarding the optimal orthodontic force magnitude that may be applied without negative effects in patients with intact periodontium. Some authors reported that orthodontic forces exceeding 0.5 N might cause periodontal ischemia in a healthy periodontium and recommended using forces of 0.2 N for the intrusion of monorooted teeth (ie, nontraumatized maxillary incisors). In contrast, other authors reported that forces up to 3 N showed no negative consequences on the periodontal tissues.
Irrespective of the level of bone loss, the maximum hydrostatic pressure (MHP; 2-16 KPa) , and the maximum tolerable stress (MTS; 15-26 KPa) , , should not be exceeded. In addition, the amount of orthodontic forces needs to be correlated with the level periodontal breakdown to prevent further tissue loss and circulatory disturbances. , , , ,
For patients with reduced periodontium, the available data regarding the use of optimal orthodontic forces without endangering the periodontal tissues is scarce. Thus, it is important to determine the effects of compression stress (S3) on the periodontal ligament (PDL) on the existing bone tissue and evaluate its influence on the periradicular circulation. ,
For an accurate analysis of tissue compression, it is important to evaluate the force absorption and dissipation, both apically and cervically at different bone levels and its impact on the periodontal circulation as related to the MHP and MTS. ,
In orthodontic biomechanics, a remodeling of the PDL and alveolar bone is triggered by tensile and compressive stresses that are the result of circulatory disturbances (ie, periodontal ischemia assessed through MHP and MTS). , Finite elements analysis (FEA) is considered a suitable method to evaluate the stress in the periodontium and represents a mathematical method used to assess the stresses by studying the pattern the loads are absorbed and dissipated in human anatomic structures. Limitations of this method are related to boundary conditions (ie, the type of analysis: linear-nonlinear, and materials properties: isotropy-anisotropy and elastic-nonelastic) on the one hand, and the accuracy of the input data (ie, anatomic accuracy of models reconstructed on radiological data) on the other hand. , , However, despite these limitations, FEA is a proper method for studying in vitro the stress in various tissues. , ,
In the last decade, the biomechanical behavior of the periodontium as assessed by FEA was evaluated using the S1 (maximum principal: tensile) and S3 (minimum principal: compressive) stress failure criterion. , , Previous FEA studies investigated the factors that lead to maximum stress in PDL. However, these studies evaluated only some types of orthodontic movements on an intact or partially reduced perio-dontium. , , , , , To the best of our knowledge, no study described so far the compression stress induced by all 5 types of orthodontic movements applied at a minimal force in patients with a gradual horizontal bone loss. Moreover, the evidence to describe a correlation between the induced force, the level of periodontal support (MTS) , , and periodontal ischemia (MHP) , is scarce. , ,
Thus, the aims of the present analysis were (1) to evaluate the biomechanical behavior of the PDL by quantitatively and qualitatively determining the compressive stress during orthodontic movements, (2) to assess the risk for further periodontal breakdown because of compression during 5 types of orthodontic movements (intrusion at 0.2 N, extrusion, rotation, tipping at 0.6 N, and translation at 1.2 N) at various levels of bone loss (0-8 mm bone loss), and (3) to perform a correlation between the applied forces and the degree of bone resorption and decrease of force magnitude and compressive stress increase in the apical PDL.
Material and methods
This article represents an analysis of the compressive stress distribution in PDL during orthodontic treatment and is part of a larger research project assessing the behavior of teeth and periodontium during orthodontic treatment at various levels of periodontal breakdown. The methodology used in this study was previously described in a recent publication of the same research project but with a focus on the dental pulp and neurovascular bundle. The protocol was approved by the Ethical Committee of the Iuliu Hatieganu University of Medicine and Pharmacy (approval no. 158/2.04.2018).
A total of 9 patients (mean age of 29.81 ± 1.45 years, 6 females) applying for orthodontic treatment with reduced noninflamed periodontium (treated chronic periodontitis) were included in this study. The mandibular right area comprising the first molar and 2 premolars was investigated using cone-beam computed tomography (CBCT) (ProMax 3DS; Planmeca, Helsinki, Finland) (voxel size, 0.075 mm).
For better anatomic accuracy, each of the 9 patients’ tooth components of the second premolar (ie, enamel, dentin, pulp, neurovascular bundle, PDL, cortical and trabecular bone, bracket) have been manually reconstructed 3-dimensionally using the manual image segmentation technique on the basis of the different gray scale values and Hounsfield units and then assembled into one 3-dimensional (3D) tooth model. All reconstructions had been done on the basis of the CBCT data using AMIRA software (version 5.4.0; Visage Imaging, Inc, Andover, Mass). Because patients exhibited various degrees of bone levels, the nine 3D tooth models (with 1 molar and 2 premolars) presented various levels of bone and PDL loss ( Fig 1 ). Each of these 9 models was then replicated, and the missing bone and PDL were manually reconstructed (manual image segmentation) to obtain models without periodontal breakdown ( Fig 1 ). Thus, nine 3D new models of the second premolar (6 single, three 2-rooted) with no periodontal loss were obtained. In each of the models, the first premolar and molar were replaced by cortical and trabecular bone. Consecutively, a gradual horizontal bone loss of 0-8 mm was simulated for every replicated model with intact periodontium ( Fig 1 ); bone and PDL were gradually horizontally reduced by 1 mm height, in a circular homogenous horizontal reduction around the second premolar. Thus, 8 models with periodontal tissue loss of 1-8 mm from each premolar model were generated, in a total of 72 models. Root cementum was assumed and reconstructed as dentin, having similar mechanical properties. The PDL was manually reconstructed with a variable thickness of 0.16-0.24 mm, and the cortical bone in an average thickness of 2 mm. The trabecular bone was also manually reconstructed filling the remaining space.
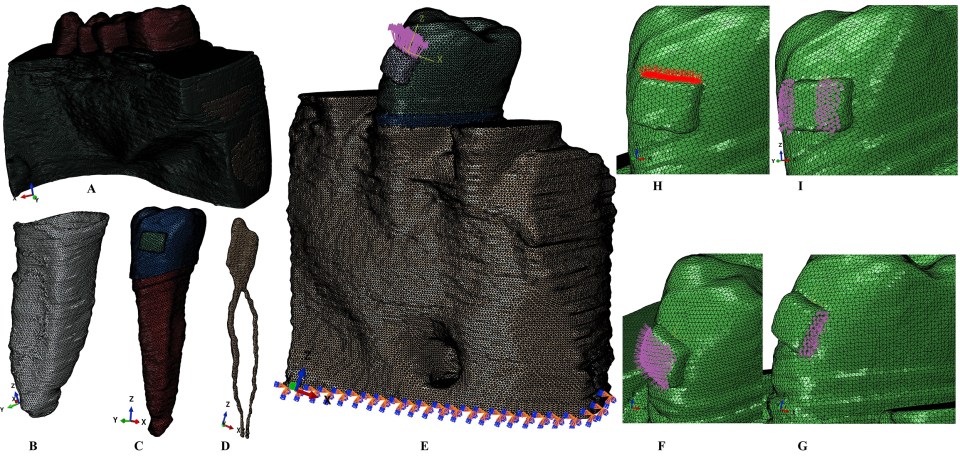
Each of the 9 complete models had 5.05-6.05 million C3D4 tetrahedral elements, 0.95-1.06 million nodes, and a global element size of 0.08-0.116 mm (thus an extremely fine grain mesh). The testing for mesh convergence was performed.
The FEA was performed in ABAQUS (version 6.11; Dassault Systèmes, Vélizy-Villacoublay, France) software. The most commonly used 5 types of orthodontic movements were simulated on each premolar (ie, applied on the brackets): intrusion (0.2 N), extrusion, rotation, tipping (0.6 N), and translation (1.2 N) ( Fig 1 ). Identical boundary conditions, material properties (ie, elastic constants), and loading conditions were assigned to each model component (ie, bone, PDL, dentin, cementum, NVB, pulp, bracket, e-mail), defining how the models would deform under the applied loads. The model structures were analyzed as a series of nodal displacements, and the resulting compressive stresses (S3) were calculated and displayed for the apical and cervical third of the PDL. Because their magnitudes reflect the mechanical behavior of the investigated structures, they were expressed numerically (average) as a color-coded projection on the geometric model ( Fig 2 ). The stress values were correlated with the reported maximum hydrostatic pressure (MHP) , and the MTS for PDL. , ,

A correlation analysis with compression values for intact periodontium (both apically and cervically) as a reference point was conducted for each orthodontic force and each level of periodontal breakdown. The mathematical percentage of compression needed for producing similar compression levels to that of intact periodontium was calculated. After a doubling of the compression values, the mathematical correlation was no longer possible. All the structures were assumed to be homogeneous, isotropic, with linear elasticity, whereas interfaces between all components were considered perfectly bonded ( Table I ). The base of the model contained both cortical and trabecular bone and was considered to have zero displacements, whereas all other components and parts of the model were treated as free of boundary conditions.
| Material | Young’s modulus, E (GPa) | Poisson ratio, υ | References |
|---|---|---|---|
| Enamel | 80 | 0.33 | , , |
| Dentin/cementum | 18.6 | 0.31 | , |
| Pulp | 0.0021 | 0.45 | |
| PDL | 0.0667 | 0.49 | |
| Cortical bone | 14.5 | 0.323 | , , |
| Trabecular bone | 1.37 | 0.3 | , , , |
| Bracket (Cr-Co) | 218 | 0.33 | , , , |
Results
There were no statistically significant differences between patients related to age, gender, or periodontal status. Quantitatively, the S3 compressive stress was lower apically than cervically, both in the intact and reduced periodontium. The highest mean stress was produced by rotation and translation, followed by tipping, extrusion, and intrusion. At all bone levels (0-8 mm bone loss), intrusion at 0.2 N produced results with negative values (mostly compression) both apically and cervically, whereas extrusion at 0.6 N produced positive values (mostly tension and less compression). Qualitatively, the translation, rotation, and tipping exhibited apically mostly compression, whereas cervically mostly tension.
The highest apical stress was observed for translation at 1.2 N (−97.79 KPa ± 0.27) and rotation at 0.6 N (−56.27 KPa ± 0.29), which was higher than MHP (16 KPa) and MTS (26 KPa). The lowest stress values were obtained during extrusion (14.1 KPa ± 0.23) and intrusion at 0.2 N (−1.74 KPa ± 0.26) ( Table II ; Fig 2 ).
| Resorption, mm | 0 | 1 | 2 | 3 | 4 | 5 | 6 | 7 | 8 |
|---|---|---|---|---|---|---|---|---|---|
| Intrusion 0.2 N | |||||||||
| a | −1.74 | −3.29 | −7.29 | −9.82 | −12.07 | −13.00 | −13.68 | −17.92 | −21.26 |
| % a | 1.00 | 1.90 | 4.20 | 5.66 | 6.95 | 7.49 | 7.88 | 10.32 | 12.25 |
| c | −1.74 | −3.21 | −4.26 | −5.58 | −6.28 | −6.82 | −7.16 | −7.97 | −8.80 |
| % c | 1.00 | 1.85 | 2.45 | 3.22 | 3.62 | 3.93 | 4.13 | 4.59 | 5.07 |
| Extrusion 0.6 N | |||||||||
| a | 14.10 | 19.27 | 28.28 | 30.10 | 38.93 | 44.98 | 50.99 | 56.00 | 64.15 |
| % a | 1.00 | 1.37 | 2.01 | 2.13 | 2.76 | 3.19 | 3.62 | 3.97 | 4.55 |
| c | 27.99 | 28.03 | 36.77 | 46.81 | 53.90 | 58.17 | 69.90 | 72.83 | 82.83 |
| % c | 1.00 | 1.00 | 1.31 | 1.67 | 1.93 | 2.08 | 2.50 | 2.60 | 2.96 |
| Translation 1.2 N | |||||||||
| a | −97.79 | −119.51 | −138.10 | −142.06 | −149.76 | −200.14 | −220.56 | −252.60 | −292.40 |
| % a | 1.00 | 1.22 | 1.41 | 1.45 | 1.53 | 2.05 | 2.26 | 2.58 | 2.99 |
| c | 93.03 | 109.97 | 123.58 | 154.20 | 171.59 | 188.90 | 209.15 | 236.07 | 260.20 |
| % c | 1.00 | 1.18 | 1.33 | 1.66 | 1.84 | 2.03 | 2.25 | 2.54 | 2.80 |
| Rotation 0.6 N | |||||||||
| a | −56.27 | −60.40 | −70.66 | −76.90 | −81.80 | −90.20 | −119.93 | −189.99 | −290.13 |
| % a | 1.00 | 1.07 | 1.26 | 1.37 | 1.45 | 1.60 | 2.13 | 3.38 | 5.16 |
| c | 68.07 | 83.61 | 90.87 | 96.09 | 102.31 | 109.71 | 119.91 | 150.26 | 170.13 |
| % c | 1.00 | 1.23 | 1.33 | 1.41 | 1.50 | 1.61 | 1.76 | 2.21 | 2.50 |
| Tipping 0.6 N | |||||||||
| a | −18.53 | −24.90 | −29.92 | −33.90 | −37.61 | −50.79 | −61.35 | −90.33 | −109.40 |
| % a | 1.00 | 1.34 | 1.61 | 1.83 | 2.03 | 2.74 | 3.31 | 4.87 | 5.90 |
| c | 28.89 | 39.94 | 50.23 | 54.06 | 60.33 | 78.48 | 90.58 | 96.41 | 102.49 |
| % c | 1.00 | 1.38 | 1.74 | 1.87 | 2.09 | 2.72 | 3.14 | 3.34 | 3.55 |
Stay updated, free dental videos. Join our Telegram channel
VIDEdental - Online dental courses


