Introduction
Rapid prototyping models can be reconstructed from stereolithographic digital study model data to produce hard-copy casts. In this study, we aimed to compare agreement and accuracy of measurements made with rapid prototyping and stone models for different degrees of crowding.
Methods
The Z Printer 450 (3D Systems, Rock Hill, SC) reprinted 10 sets of models for each category of crowding (mild, moderate, and severe) scanned using a structured-light scanner (Maestro 3D, AGE Solutions, Pisa, Italy). Stone and RP models were measured using digital calipers for tooth sizes in the mesiodistal, buccolingual, and crown height planes and for arch dimension measurements. Bland-Altman and paired t test analyses were used to assess agreement and accuracy. Clinical significance was set at ±0.50 mm.
Results
Bland-Altman analysis showed the mean bias of measurements between the models to be within ±0.15 mm (SD, ±0.40 mm), but the 95% limits of agreement exceeded the cutoff point of ±0.50 mm (lower range, −0.81 to −0.41 mm; upper range, 0.34 to 0.76 mm). Paired t tests showed statistically significant differences for all planes in all categories of crowding except for crown height in the moderate crowding group and arch dimensions in the mild and moderate crowding groups.
Conclusions
The rapid prototyping models were not clinically comparable with conventional stone models regardless of the degree of crowding.
Highlights
- •
Three-dimensional printing (3DP) and conventional study models were compared.
- •
Measurements were generally significantly different regardless of the type of crowding.
- •
The mean biases were within ±0.15 mm (SD, <0.40 mm) but were significantly different ( P <0.05).
- •
The 95% limits of agreement were beyond the acceptable clinical significance set at ±0.50 mm.
- •
The 3DP models produced were not clinically acceptable alternatives for linear measurements.
Three-dimensional (3D) digital anatomic models are becoming more acceptable in practice to replace conventional stone study models. The special advantage of these digital models is their ease of storage, data retrieval, and transferability to overcome the shortcomings of physical models, which not only require a large storage area and risk damage leading to information loss, but also are inconvenient to share with other clinicians. Institutions with large collections of historic patient study models that are kept for medicolegal reasons and research purposes could address the issue of storage space by scanning and storing these models in digital format. However, some may hesitate to dispose of these stone models after the records are kept in digital format because there may be occasions, such as in medicolegal circumstances, when tangible records are required. An emerging technology called rapid prototyping (RP) to produce graspable 3D objects directly from digital models may be able to address this need for physical models. This technology can be categorized as an additive manufacturing process, which first slices the digital model into layers of a certain thickness and then prepares the physical model by building layer upon layer. However convenient RP may be, we must investigate this tool to ascertain whether it could be a clinically acceptable alternative to stone study models.
In medicine and dentistry, RP technologies have gained interest for such applications as manufacture of anatomic models as aids for visualization, diagnosis, discussion, and surgical planning, especially for neurologic and oral and maxillofacial surgery. Examples of RP techniques used include 3D printing, stereolithography, selective laser sintering, and fused deposition manufacturing. The fabrication versatility of 3D printing is evident in its ability to fabricate the full spectrum of powder materials (ceramics, metals, and polymers) and its ability to control pore characteristics (size, morphology, and volume fraction) with high repeatability and reproducibility. This method allows the manipulation of the chemical, physical, and mechanical properties of the manufactured product. These characteristics are particularly desirable for biocompatible applications such as implantable materials and tissue-engineered scaffolds for medical and dental devices. Describing and explaining plans for complex craniomaxillofacial procedures in orthognathic surgery, which can be conceptually difficult, may become less challenging with 3D medical modeling. This RP method assists in the preparation of operative procedures by producing an exact copy of the patient’s skull and facial structures based on radiographic data, which allow surgeons to visually simulate osteotomies before surgery. More recent applications include the use of rapid prototype wafers for surgical models. The rapid prototype wafers were based on virtual wafers derived from laser scans of dental models using computer-aided design and computer-aided manufacture software.
Few studies have compared conventional and reconstructed models. Germani and Raffaeli compared 4 types of RP study models, 2 of which were manufactured using different materials. All replicas had varying degrees of small dimensional errors that were influenced by the size of the detail to be reproduced. However, the effect of the reduced detail in dental morphology on the clinical acceptability was not within the scope of the study. Due to financial constraints, Keating et al compared a reconstructed model generated by the SLA-250/40 stereolithographic machine (3D Systems, Rock Hill, SC) with a build-layer thickness of 0.15 mm with its original conventional stone model. They found that the statistically significant differences were mainly due to errors in the vertical thickness of the z-plane measured based on crown heights (mean difference, 0.42 mm; SD, 0.23 mm) attributed to the RP method, which builds the model layer by layer, and the layering method and model translucency, which resulted in some loss in surface detail and made landmark identification difficult. Kasparova et al found no significant differences between conventional and RP models constructed using the RepRap 3D printer with a build thickness of 0.35 mm. The differences between the plaster and RP models were not statistically significant. However, they limited their measurements to 1 linear measurement for each x-, y-, and z-axis and a mixed x-y axis. Based on standard deviations that were less than 0.50 mm, they concluded that RP models had acceptable clinical accuracy compared with conventional models.
None of these authors investigated the influence of crowding on the accuracy of the reconstructed models. In crowded areas, teeth can overlap, and it may be more difficult to reproduce with good accuracy the undercut areas that are blocked from the sensor’s view during scanning. Fleming et al reviewed studies that compared conventional and digital models. They found varying reported results but minimal differences and seemed to advocate the differences as clinically acceptable. However, data distortion during data conversion and manipulation to convert the digital surface information to the stereolithography file format and the subsequent model shrinkage during building and postcuring from the RP technique may further influence the accuracy of the reconstructed models.
The aim of this study was to compare orthodontic stone models with the 3D printed RP models across degrees of crowding. To date, no studies have been published evaluating the clinical acceptability of the reconstructed models using the Z Printer 450 (3D Systems), which has a build-layer thickness of 0.089 to 0.102 mm, as duplicates to conventional models for different degrees of crowding. This study will be of particular interest in determining institutional record-keeping policy whether to dispose of conventional stone models that have been digitally scanned before the limit of the national legally required time for retention of clinical records.
Material and methods
Ethical approval for this study was obtained from the medical ethics committee, Faculty of Dentistry, University of Malaya (DF CD1303/0016[P]), Kuala Lumpur, Malaysia.
Sample size estimation was based on a previous study by Keating et al and calculated using PS Software (Power and Sample Size Calculations version 3.0.17; William D Dupont and W Dale Plummer Jr, Department of Biostatistics, Vanderbilt University, Nashville, Tenn.). For the RP model, a minimum of 10 models per category of crowding was required for a 90% chance to detect a related sample mean with a difference of 0.26 mm and a standard deviation of 0.22 mm at the 5% level of significance (power, 0.90; α, 0.05; δ, 0.26; and σ, 0.22).
Crowding was estimated based on the total mesiodistal width against the available space in the arch. The degree of crowding was classified as mild (1-4 mm), moderate (5-8 mm), or severe (>9 mm). New models were used to exclude any confounding caused by variability of the materials used to cast the plaster models. Impressions were taken from recruited patients on the orthodontic waiting list. The inclusion criteria were mild, moderate, or severe crowding in any malocclusion, and fully erupted complete permanent dentition from first molar to contralateral first molar. The exclusion criteria were previous or ongoing orthodontic treatment and significant dental anomalies, eg, supernumerary teeth or an abnormal tooth shape that could obscure landmark identification. The study models included were those with good surface details; those with surface marks, voids, and fractures were excluded.
Study models were cast in white stone (Elite Ortho; Zhermack, Badia Polesine, Italy). The stone models were scanned using a structured light scanner (Maestro 3D; AGE Solutions, Pisa, Italy) via EasyDentalScan software (AGE Solutions) and exported as binary stereolithographic files. The base area of each digital model was trimmed using biomodeling software (BioModroid; CBMTI, Kuala Lumpur, Malaysia). The size of the models was reduced to preserve only the dentition and the immediate alveolar bases to minimize printing costs, which were proportional to the dimensions of the model. The models were produced using the RP machine (Z Printer 450; 3D Systems). The printing material comprised high performance composite (Zp151; 3D Systems). A clear binder (Zb63; 3D Systems) was used during the curing process. Modeling infiltrant (Z-bond 101; 3D Systems) was used during postprocessing to strengthen the printed model.
For the stone and RP models, measurements of parameters were taken with a hand-held digital caliper (Fowler High Precision Tools & Measuring Instruments, Newton, Mass) to the nearest 0.01 mm ( Fig 1 ).
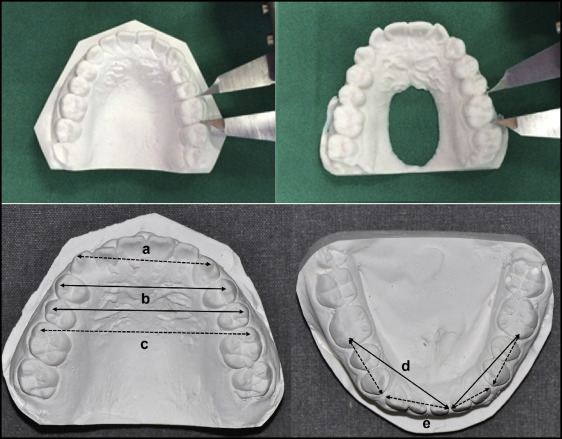
To assess whether the quality of the RP models would be clinically acceptable for linear measurements, measurements were made of clinically relevant parameters: tooth sizes and arch dimensions. Tooth sizes were further defined as follows.
- 1.
Mesiodistal widths. The greatest mesiodistal diameter from the anatomic mesial contact point to the anatomic distal contact point of each tooth parallel to the occlusal plane.
- 2.
Buccolingual or palatal widths. Distance between the maximum concavities of the buccal and lingual surfaces.
- 3.
Clinical crown height. Distance between the cusp tip to the cervical level.
Arch dimensions ( Fig 1 ) comprised the following.
- 1.
Intercanine width. Distance between the occlusal tips of the canines.
- 2.
Interpremolar width. Distance between the buccal cusp tips of the contralateral first and second premolars.
- 3.
Intermolar width. Distance between the mesiobuccal cusp tips of the contralateral first molars.
- 4.
Arch length. Diagonal distance between the mesiobuccal cusp tips of the first molars and the mesiodistal contact areas of the central incisors.
- 5.
Arch perimeter segments. Sum of the bilateral arch segments. The first segment is the distance between the distal measurement point of the first molar and the mesial contact point of the first premolar; the second segment is the distance from the distal contact point of the canine to the mesial contact point of the central incisor.
To assess operator reliability in measurements using the digital caliper, 3 pairs of study models (10% of the sample), each comprising a pair from each category, were randomly selected using online Research Randomizer ( www.randomizer.org ) software. For intraexaminer reliability, each study model was measured by the same examiner (Y.Y.) on 2 occasions with an interval of at least 2 weeks. The first measurements were compared with those obtained by a second examiner (W.N.W.H.) for assessment of interoperator reliability.
Statistical analysis
Data were analyzed with SPSS software (version 12.0.1; SPSS, Chicago, Ill) and MedCalc software (MedCalc, Ostend, Belgium).
The intraexaminer and interexaminer reliability values for individual parameters were assessed using the intraclass correlation coefficient (ICC): an ICC less than 0.40 is considered poor, between 0.40 and 0.75 is fair to good, and more than 0.75 is excellent. To reduce statistical errors due to multiple analyses, the parameters were compared in terms of the differences in tooth size in the 3 planes (mesiodistal, buccolingual, and crown height) and arch dimensions rather than by individual parameters. Histograms and quantile-quantile plots indicated that the differences between measurements made on the stone and RP models were normally distributed for the different degrees of crowding (mild, moderate, and severe). Bland-Altman analysis was done to assess agreement, and paired t tests were used for accuracy of the measurements between the 2 types of study models based on the degree of crowding. Clinical significance was set at 0.50 mm.
Results
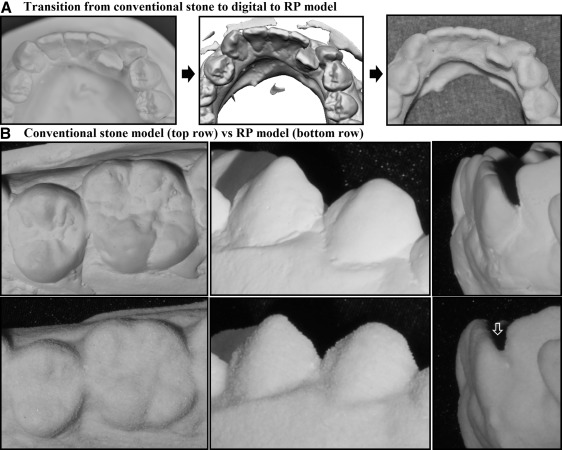
The sample comprised 10 sets of study models for each category of crowding. Figure 2 , A , shows that generally the fine details of the models (fissures and cervical margins) were incrementally reduced as the models transformed from stone to digital and then to RP models. Stone models generally have smooth surfaces and show well-defined boundaries of the interproximal contact points and cervical margins, which demarcate the anatomy of each tooth from the adjacent teeth and from the gingival margins. Minor artifacts such as air bubbles and slightly excessive stone materials were observed but were considered negligible because they were small and away from the landmarks used for measurements. On the other hand, the surfaces of the RP models were coarse. The models were well intact even though the surfaces appeared flaky. The cervical margins, fissures, fossae, and cuspal tips of the RP models were also less defined than the original stone models ( Fig 2 , B ). The minor artifacts on the stone models were generally not replicated like the original models or had less obvious margins; this made the distinction between normal anatomic boundaries and artifacts less recognizable than on the stone models. Interproximal contact points were also less demarcated, with additional artifacts observed especially in areas close to the undercuts between overlapped teeth. At the sites of crowding, the clinical impression was that as the degree of crowding increased, the contact areas between the crowded teeth were also less defined and more likely to have a slight surplus of artifacts.
For measurements using the digital caliper, the intraoperator ICC values had excellent agreement (>0.75) and ranged from 0.817 to 0.999. The interoperator ICC values also had excellent agreement, ranging from 0.818 to 0.999.
Figure 3 shows the Bland-Altman plots of the differences between the measurements made on the stone and RP models (x-axis) against the average values of the measurements made on the 2 models (y-axis). The plots were randomly distributed along the mean bias line for all planes and degrees of crowding, indicating that the differences did not depend on the magnitude of the measurements. Systematic bias was observed where the mean bias line tended to be slightly lower (RP was larger) in the mesiodistal plane but slightly higher (RP was smaller) in the buccolingual plane for all categories of crowding. The systematic bias values for the crown height and arch dimension planes were close to the 0 line.
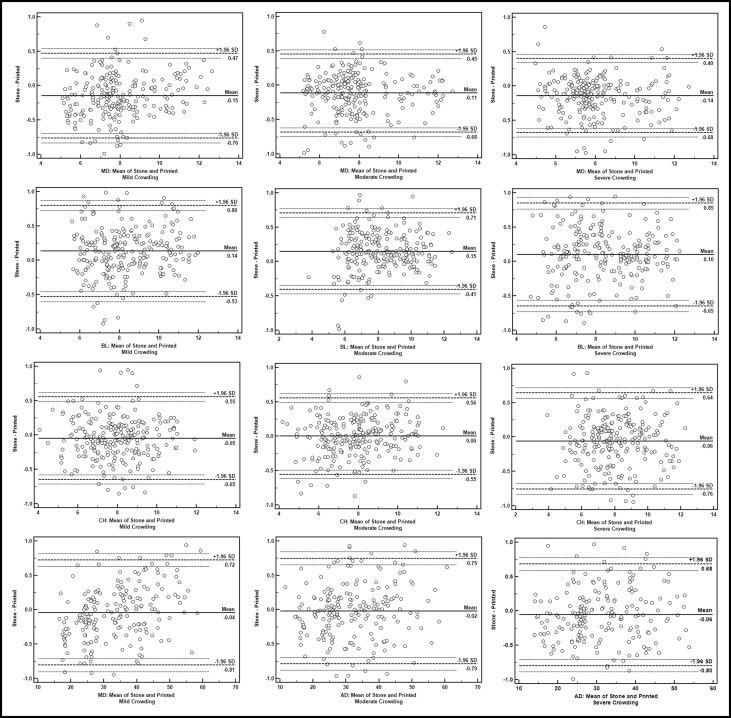
The Table , for the Bland-Altman analysis, shows that the mean bias between the stone and RP models for the different degrees of crowding in all planes was small and was within ±0.15 mm, with standard deviations that were within ±0.40 mm. However, for most measurements, the 95% limits of agreement were beyond the cutoff points of acceptable clinical difference (greater than ±0.50 mm).
| Plane (n) | Crowding | Bland-Altman (stone minus RP) in mm | Paired t test (stone minus RP) in mm | |||||||||||
|---|---|---|---|---|---|---|---|---|---|---|---|---|---|---|
| Mean bias | SD | 95% limits of agreement | Mean | SD | 95% CI | P value | ||||||||
| Lower limit | 95% CI of lower limit | Upper limit | 95% CI of upper limit | Lower | Upper | |||||||||
| MD (240) | Mild | −0.15 | 0.31 | −0.73 | −0.86 | −0.69 | 0.47 | 0.40 | 0.54 | −0.15 | 0.31 | −0.19 | −0.11 | 0.000 ∗ |
| Moderate | −0.11 | 0.29 | −0.68 | −0.74 | −0.62 | 0.45 | 0.39 | 0.52 | −0.11 | 0.29 | −0.15 | −0.08 | 0.000 ∗ | |
| Severe | −0.14 | 0.28 | −0.68 | −0.74 | −0.62 | 0.40 | 0.34 | 0.46 | −0.14 | 0.28 | −0.17 | −0.10 | 0.000 ∗ | |
| BL (240) | Mild | 0.14 | 0.34 | −0.53 | −0.60 | −0.45 | 0.80 | 0.72 | −0.87 | 0.14 | 0.34 | 0.09 | 0.18 | 0.000 ∗ |
| Moderate | 0.15 | 0.28 | −0.41 | −0.47 | −0.35 | 0.71 | 0.64 | 0.77 | 0.15 | 0.28 | 0.11 | 0.19 | 0.000 ∗ | |
| Severe | 0.10 | 0.38 | −0.65 | −0.73 | −0.53 | 0.85 | 0.76 | 0.93 | 0.10 | 0.38 | 0.05 | 0.15 | 0.000 ∗ | |
| CH (240) | Mild | −0.05 | 0.31 | −0.65 | −0.71 | −0.58 | 0.55 | 0.49 | 0.62 | −0.05 | 0.31 | −0.09 | −0.01 | 0.000 ∗ |
| Moderate | 0.00 | 0.28 | −0.55 | −0.62 | −0.49 | 0.56 | 0.49 | 0.62 | 0.00 | 0.28 | −0.04 | 0.04 | 0.967 | |
| Severe | −0.06 | 0.36 | −0.76 | −0.83 | −0.68 | 0.64 | 0.56 | 0.72 | −0.06 | 0.36 | −0.10 | −0.01 | 0.012 ∗ | |
| AD (200) | Mild | −0.04 | 0.39 | −0.81 | −0.90 | −0.71 | 0.72 | 0.63 | 0.81 | −0.04 | 0.39 | −0.10 | 0.01 | 0.126 |
| Moderate | −0.02 | 0.39 | −0.79 | −0.88 | −0.69 | 0.75 | 0.66 | 0.84 | −0.02 | 0.39 | −0.07 | 0.04 | 0.499 | |
| Severe | −0.06 | 0.38 | −0.80 | −0.89 | −0.71 | 0.68 | 0.59 | 0.77 | −0.06 | 0.38 | −0.11 | −0.00 | 0.036 ∗ | |
Stay updated, free dental videos. Join our Telegram channel
VIDEdental - Online dental courses


