Introduction
The aims of this study were to evaluate the differences between 2 regions of maxillary voxel-based registration and to test the reproducibility of the registration.
Methods
Three-dimensional models were built for before-treatment (T1) and after-treatment (T2) based on cone-beam computed tomography images from 16 growing subjects. Landmarks were labeled in all T2 models of the maxilla, and voxel-based registrations were performed independently by 2 observers at 2 times using 2 reference regions. The first region, the maxillary region, included the maxillary bone clipped inferiorly at the dentoalveolar processes, superiorly at the plane passing through the right and left orbitale points, laterally at the zygomatic processes through the orbitale point, and posteriorly at a plane passing through the distal surface of the second molars. In the second region, the palate and infrazygomatic region had different posterior and anterior limits (at the plane passing through the distal aspects of the first molars and the canines, respectively). The differences between the registration regions were measured by comparing the distances between corresponding landmarks in the T2 registered models and comparing the corresponding x, y, and z coordinates from corresponding landmarks. Statistical analysis of the differences between the T2 surface models was performed by evaluating the means and standard deviations of the distances between landmarks and by testing the agreement between coordinates from corresponding landmarks (intraclass correlation coefficient and Bland-Altman method).
Results
The means of the differences between landmarks from the palate and infrazygomatic region to the maxillary region 3-dimensional surface models at T2 for all regions of reference, times of registrations, and observer combinations were smaller than 0.5 mm. The intraclass correlation coefficient and the Bland-Altman plots indicated adequate concordance.
Conclusions
The 2 regions of regional maxillary registration showed similar results and adequate intraobserver and interobserver reproducibility values.
Highlights
- •
We evaluated differences between 2 methods of maxillary voxel-based registration.
- •
We tested the reproducibility of the methods.
- •
Differences were measured by distances between corresponding landmarks in the models.
- •
We tested interobserver reproducibility of the x, y, and z coordinates.
- •
The 2 methods showed similar results and adequate interobserver reproducibility.
Growth and development of the face have important roles in determining the overall facial pattern and the nature of the occlusion. Previous studies have shed light on the complex mechanisms of maxillary and mandibular growth and remodeling, but a better understanding of the direction, amount, and pattern of growth, as well the response to treatment, still is required. A correct jaw relationship depends on adequate interactions among a series of basal and dentoalveolar adaptations in the sagittal, vertical, and transverse planes. Serial cephalometric radiographs have been used for dynamic studies of these interactions in growing children ; in particular, longitudinal implant studies have indicated stable areas of reference for understanding regional changes during growth.
Superimposition on these stable maxillary structures can be used to evaluate growth and treatment changes in the maxillary dentoalveolar complex. Multiple registration regions and superimposition methods have been proposed in the literature. The “structural method” based on stable structures of the maxilla (eg, anterior surface and tip of the zygomatic process or “key ridge”) was found to be almost equivalent to the implant method. On the other hand, superimpositions along the palatal plane using the anterior nasal spine as a reference were less reproducible in relation to the structural method. A superimposition with the best fit of internal palatal structures has also been proposed by McNamara. However, the methods of Björk and Björk and Skieller of superimpositions on metallic implants still remain the gold standard for maxillary structures. Currently, however, there are ethical implications for implant placements for research purposes.
The advent of three-dimensional (3D) cone-beam computed tomography (CBCT) allowed the observation of skeletal and dental changes that could not be attempted with standard 2-dimensional (2D) radiographs. Three-dimensional registrations offer advantages over 2D images, including volumes and regions of interest for registration rather points or lines, lack of distortion of bilateral structures, and fewer head positioning errors. However, anatomic structures reported to be stable on a lateral headfilm may not be reliable for 3D analysis that also involves the transverse dimension.
Cevidanes et al and da Mota et al validated a method for voxel-based superimposition of the cranial base to assess posttreatment changes in growing and adult patients, respectively. Based on the cranial base registrations, it is possible to quantify the skeletal displacements of both the maxilla and the mandible relative to the anterior cranial base when used as a stable reference structure. Recently, Schilling et al suggested a regional superimposition method to assess dental changes and subtle bone remodeling in the mandible that considers the symphysis as a stable reference structure. To date, no study in the literature has described the 3D voxel-based regional superimposition method for the maxilla.
In this study, we had 2 objectives: to evaluate the differences between 2 regions of maxillary voxel-based registration and to test the intraobserver and interobserver reproducibility values of these registrations.
Material and methods
This retrospective study was based on a sample of 16 growing subjects (ages, 9-13 years) comprising 8 subjects treated with rapid maxillary expansion for crossbite correction and 8 subjects treated with the Herbst appliance for the correction of Class II malocclusion. CBCT scans (0.4-mm voxel size; 16 × 22-cm field of view) of all subjects were already available at 2 times with at least 6 months between them, before treatment (T1) and after treatment (T2), taken with an i-Cat machine (Imaging Sciences International, Hatfield, Pa).
This study was approved by the University of Michigan institutional review board (HUM00095895).
After converting the DICOM files to “guys image processing lab (gipl)” files using ITK-SNAP open-source software ( http://www.itksnap.org ), the 3D image analysis procedures followed these steps.
- 1.
Approximation of T1 and T2 scans. The T1 and T2 gipl files were approximated manually by the same observer (A.C.O.R.) with a best fit of the maxillary outlines in 3D multiplanar cross-sections using open-source software (Slicer version 4.3.1; http://www.slicer.org ).
- 2.
Construction of 3D volumetric label maps of the maxilla (segmentation). The construction of 3D volumetric label maps for the T1 and T2 scans was performed with ITK-SNAP software. The automatic segmentation procedures in ITK-SNAP use active contour methods to compute feature images based on the CBCT images’ gray level intensities and boundaries. The threshold was adjusted scan by scan, since the ITK-SNAP permits adjustment of the parameters for automatic detection of intensities and boundaries and allows interactive editing of the contours by the user. The anatomic structures that were segmented for reference (regions of reference) indicated to the software where it should look for corresponding voxels. The segmentations were also used to build 3D surface mesh models (.stl) that were loaded into software (VECTRA Analysis Module, version 3.7.6; Canfield Scientific, Fairfield, NJ) to generate the landmark coordinates and the distances between landmarks.
- 3.
Placement of landmarks on the 3D volumetric label maps at T2. One observer (A.C.O.R.) labeled 6 landmarks in all T2 models in different regions of the maxilla to eliminate errors of pitch, roll, and yaw, and also to prevent any landmark identification errors ( Fig 1 ). One label not used in the 3D volumetric label maps was used to label the landmarks in the following regions: zygomatic processes of the maxilla on both sides, buccal surfaces of the maxillary first molars on both sides, anterior nasal spine, and proximal contact points between the maxillary central incisors. The landmarks were labeled in 2 consecutive slices using the paintbrush tool. The same 3D volumetric label maps, labeled with the landmarks, were used by both observers (A.C.O.R., M.R.G.) for the registration procedures to prevent errors caused by segmentation or landmark placement.
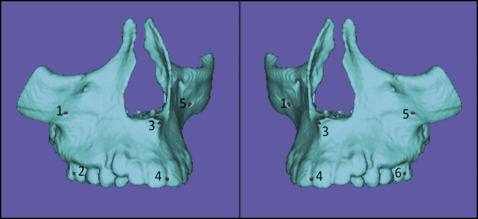
Fig 1 Images showing 3D models at T2 with the 6 prelabeled landmarks used to obtain the measurements for comparison between the registration methods and between observers. - 4.
Clipping (cropping) of the masks for each registration region. The 3D volumetric label maps at T2, prelabeled with the landmarks, were cropped by 2 calibrated observers (A.C.O.R., M.R.G.). They were trained and calibrated to perform the cropping using a set of ten 3D volumetric label maps not included in this study. The procedures of cropping and registration were performed at 2 times with a 3-month interval between the registrations by the same 2 observers working independently. Two regions of reference (mask) were defined for the voxel-based registration procedures ( Figs 2 and 3 ): (1) the maxillary (MAX) region of reference included the maxillary bone cropped inferiorly at the dentoalveolar processes; superiorly, the regions above the plane through the right and left orbitale points; bilaterally, the zygomatic processes at orbitale points; and posteriorly at a plane through the distal surface of the second molars; and (2) the “Björk-inspired” palate and infrazygomatic region of reference (PIZ) had different posterior and anterior limits (respectively, the planes passing through the distal aspects of the first molars and the canines).
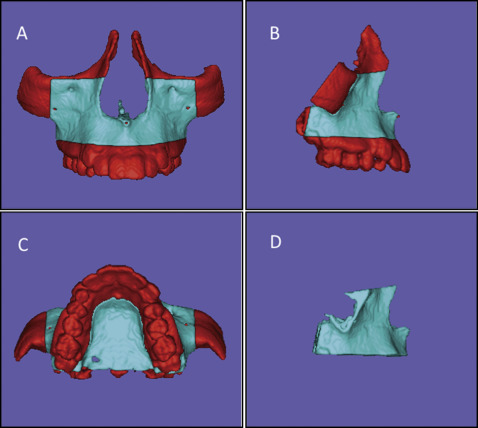
Fig 2 Images of the cropping to define the MAX region of interest (mask shown in blue ) used as the reference for the voxel-based MAX registration method: A, B, and C, superior, inferior, and lateral limits of the mask, respectively ( red refers to regions that will be excluded or cropped); D, final mask for MAX registration.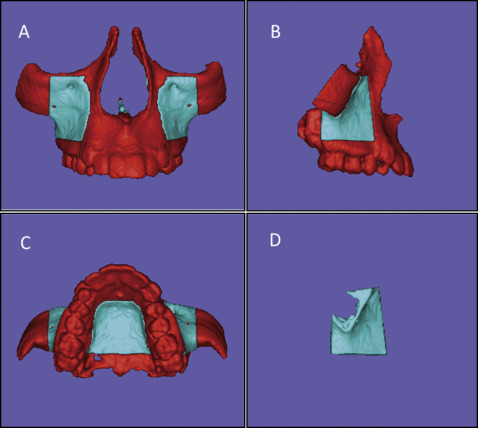
Fig 3 Images of the cropping to define the PIZ region of interest (mask shown in blue ) used as the reference for the voxel-based PIZ registration: A, B, and C, superior, inferior, and lateral limits of the mask, respectively ( red refers to regions that will be excluded); D, final mask for PIZ registration. - 5.
Voxel-based registration procedures. These procedures used the anatomic structures described above as masks for reference, indicating to the software in which areas it should look for corresponding voxels to register the T2 scan (with landmarks prelabeled with a different label) in relation to the T1 scan. After the user had selected the region of reference for registration, a fully automated voxel-based registration method was performed with the Slicer software. The software compares the gray-level values voxel by voxel, within the region of reference, in 2 CBCT images (T1 and T2) maximizing mutual information to compute the rotation and translation parameters between them. Because the sample consisted of growing patients, the scans at the 2 times had different sizes. For this reason, a fully automated voxel-wise rigid growing registration method (that takes into account that the images have different sizes but applies only 6 degrees of freedom of rotation and translation to the T2 scan) was performed. The registrations were voxel based on the region of reference, and the software generated (as an output file) the 3D volumetric labeled maps registered over T1. The 3D mesh surface models were generated from those output files. Then the 3D volumetric label maps (prelabeled with landmarks) at T2 resulting from the registration based on the MAX and PIZ regions of registration, performed twice independently by the 2 observers, were saved as 3D surface mesh models (.stl files) with landmarks already placed, using the Slicer software.
- 6.
Landmark-based quantitative assessments in VAM software (VECTRA Analysis Module, version 3.7.6). The 3D surface mesh models (.stl files) at T2 with landmarks already placed, registered by the 2 regions of reference and cropped by the 2 calibrated observers at the 2 times, were loaded in the VECTRA software. It generated the coordinates for each landmark and the Euclidean distances between corresponding landmarks. These values were statistically analyzed in 3 ways to assess the intraoberver and interobserver reproducibility values and the consistency of the regions of reference. Figure 4 displays the flowchart of the study methodology.
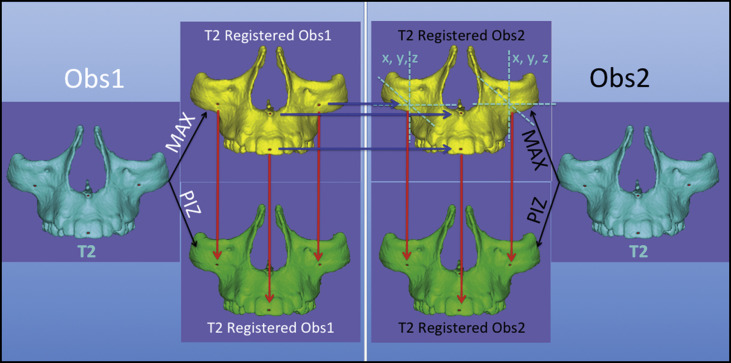
Fig 4 Flowchart of the study methodology. The light blue box on the left shows the procedures performed by observer 1 ( Obs1 ), and on the right by observer 2 ( Obs2 ). Both observers used the same maxillary surface model shown in cyan that was constructed for each CBCT scan at T2 and prelabeled with landmarks. Maxillary surface models shown in yellow indicate the registration with the MAX reference and, in models in green , the registration with the PIZ as the reference. The red arrows indicate the measurements for comparison between the 2 methods, and the blue arrows indicate the interobserver assessments. - 7.
Color-coded assessment. Interactive visual analytic evaluations of surface differences were performed by graphic displays of color-coded maps and semitransparent overlays for visual intraobserver and interobserver comparisons and to compare the 2 regions of reference.
Statistical analysis
The following statistical tests were carried out to test the consistency of the 2 regions of reference (MAX and PIZ) and the intraobserver and interobserver reproducibility values: (1) descriptive statistics of the differences between the registered T2 .stl models including means and standard deviations between corresponding prelabeled landmarks; (2) consistency testing with the intraclass correlation coefficient (ICC, with the 2-way random-effects model) by comparisons between the corresponding x, y, and z coordinates of the corresponding prelabeled landmarks on the surfaces of the registered T2 .stl models; and (3) Bland-Altman plots of the 95% limits of agreement (average differences ±1.96 of the standard deviation of the differences) evaluating the concordance between the corresponding x, y, and z coordinates from corresponding prelabeled landmarks on the surfaces of the registered T2 .stl models.
All statistical computations were performed with statistical software (version 21.0; IBM, Armonk, NY; and version 14.10.2; MedCalc Software, available at http://www.medcalc.org ).
Results
Table I shows the descriptive statistics for the measurements with the MAX and PIZ registration regions for both observers and both times. The means of the Euclidean distances between the T2 .stl models after registrations were small at all landmarks for all combinations tested (all means were smaller than 0.5 mm). When we considered the standard deviations, all differences between the models registered by the 2 regions were 1.0 mm or less.
| Types of comparisons | Mean ± SD (mm) |
|---|---|
| Between regions of registration | |
| MAX Obs1 × PIZ Obs1 R1 | 0.37 (±0.24) |
| MAX Obs1 × PIZ Obs1 R2 | 0.36 (±0.24) |
| MAX Obs2 × PIZ Obs2 R1 | 0.35 (±0.23) |
| MAX Obs2 × PIZ Obs2 R2 | 0.39 (±0.24) |
| Intraobserver | |
| MAX R1 × MAX R2 Obs1 | 0.31 (±0.16) |
| PIZ R1 × PIZ R2 Obs1 | 0.33 (±0.20) |
| MAX R1 × MAX R2 Obs2 | 0.37 (±0.18) |
| PIZ R1 × PIZ R2 Obs2 | 0.44 (±0.28) |
| Interobserver | |
| MAX Obs1 × MAX Obs2 R1 | 0.38 (±0.21) |
| MAX Obs1 × MAX Obs2 R2 | 0.36 (±0.23) |
| PIZ Obs1 × PIZ Obs2 R1 | 0.42 (±0.21) |
| PIZ Obs1 × PIZ Obs2 R2 | 0.41 (±0.24) |
The statistics to test the concordance (ICC) between regions of reference for registration and for intraobserver and interobserver reproducibility values showed excellent consistency (>0.99).
The consistency between regions of registration, and between intraobserver and interobserver reproducibility values, is shown in Table II . Using limits of agreement of Bland and Altman, one would expect that 95% of the differences between corresponding coordinates for all 6 corresponding landmarks obtained from the registrations in this study would be within the range of −0.82 to 0.77 mm. Figure 5 gives 1 example of consistency between the 2 regions used for registration ( Fig 5 , A ) and intraobserver and interobserver agreement values ( Fig 5 , B and C , respectively) for landmark 6.
| Types of comparisons | Landmark 1 | Landmark 2 | Landmark 3 | Landmark 4 | Landmark 5 | Landmark 6 | ||||||
|---|---|---|---|---|---|---|---|---|---|---|---|---|
| Mean | LoA | Mean | LoA | Mean | LoA | Mean | LoA | Mean | LoA | Mean | LoA | |
| Between regions of registration | ||||||||||||
| MAX Obs1 × PIZ Obs1 R1 | 0.08 | −0.38, 0.54 | 0.04 | −0.51, 0.59 | 0.05 | −0.48, 0.57 | 0.05 | −0.45, 0.55 | 0.01 | −0.37, 0.39 | 0.04 | −0.50, 0.59 |
| MAX Obs1 × PIZ Obs1 R2 | 0.01 | −0.37, 0.39 | 0.02 | −0.65, 0.60 | 0.00 | −0.42, 0.43 | 0.03 | −0.54, 0.61 | 0.04 | −034, 0.42 | 0.06 | −0.47, 0.58 |
| MAX Obs2 × PIZ Obs2 R1 | 0.04 | −0.39, 0.46 | −0.06 | −0.66, 0.53 | −0.01 | −0.46, 0.43 | −0.03 | −0.59, 0.52 | 0.06 | −0.34, 0.46 | 0.04 | −0.44, 0.53 |
| MAX Obs2 × PIZ Obs2 R2 | 0.05 | −0.51, 0.60 | 0.01 | −0.53, 0.55 | 0.01 | −0.47, 0.50 | 0.01 | −0.55, 0.57 | 0.00 | −0.52, 0.52 | 0.09 | −0.48, 0.67 |
| Intraobserver | ||||||||||||
| MAX R1 × MAX R2 Obs1 | 0.03 | −0.38, 0.43 | 0.04 | −0.37, 0.45 | 0.00 | −0.48, 0.48 | −0.03 | −0.43, 0.36 | 0.01 | −0.38, 0.40 | −0.03 | −0.44, 0.39 |
| PIZ R1 × PIZ R2 Obs1 | −0.02 | −0.47, 0.43 | −0.02 | −0.53, 0.48 | −0.03 | −0.54, 0.47 | −0.05 | −0.46, 0.36 | 0.04 | −0.27, 0.36 | −0.01 | −0.34, 0.32 |
| MAX R1 × MAX R2 Obs2 | 0.01 | −0.46, 0.48 | 0.00 | −0.52, 0.52 | 0.02 | −0.49, 0.52 | −0.03 | −0.67, 0.62 | 0.04 | −0.36, 0.43 | 0.00 | −0.42, 0.41 |
| PIZ R1 × PIZ R2 Obs2 | 0.06 | −0.50, 0.62 | 0.07 | −0.65, 0.80 | 0.05 | −0.55, 0.64 | 0.02 | −0.50, 0.54 | −0.03 | −0.52, 0.47 | 0.05 | −0.51, 0.60 |
| Interobserver | ||||||||||||
| MAX Obs1 × MAX Obs2 R1 | 0.04 | −0.44, 0.52 | 0.04 | −0.46, 0.54 | 0.00 | −0.51, 0.50 | −0.01 | −0.53, 0.50 | 0.00 | −0.36, 0.37 | 0.04 | −0.50, 0.59 |
| MAX Obs1 × MAX Obs2 R2 | 0.03 | −0.36, 0.42 | 0.00 | −0.48, 0.48 | 0.01 | −0.58, 0.60 | −0.01 | −0.62, 0.60 | 0.03 | −0.41, 0.47 | −0.01 | −0.43, 0.41 |
| PIZ Obs1 × PIZ Obs2 R1 | −0.04 | −0.63, 0.55 | −0.07 | −0.82, 0.67 | −0.06 | −0.57, 0.46 | −0.10 | −0.66, 0.46 | 0.06 | −0.33, 0.45 | −0.03 | −0.58, 0.53 |
| PIZ Obs1 × PIZ Obs2 R2 | 0.04 | −0.52, 0.60 | 0.03 | −0.71, 0.77 | 0.02 | −0.59, 0.63 | −0.03 | −0.56, 0.49 | −0.02 | −0.41, 0.38 | 0.03 | −0.55, 0.61 |
Stay updated, free dental videos. Join our Telegram channel
VIDEdental - Online dental courses


