Introduction
The goals of this study were to compare the effects that cervical and high-pull headgear have on the vertical dimensions in Class II Division 1 patients during phase 1 treatment and to compare these effects with untreated predicted growth for the sample population.
Methods
Pretreatment and posttreatment cephalometric radiographs of children who had undergone Class II Division 1 correction with cervical (n = 22) or high-pull headgear (n = 19) were analyzed for the measurements that describe the changes in the vertical component of growth and mandibular position. The groups were matched for age (mean, 9 ± 2.5 years), treatment time (mean, 14 months), malocclusion, and similar skeletal features. The groups were compared with each other and also with an untreated growth model.
Results
Treatment with cervical headgear resulted in smaller increases in measurements that describe the vertical dimension than with high-pull headgear. Cervical headgear showed more favorable changes in mandibular growth that were statistically significant when compared with the untreated growth models.
Conclusions
In this study, the cervical headgear showed more control over the vertical dimension and produced more favorable changes in mandibular position by normalizing the occlusal plane. Compared with the untreated growth model, cervical headgear worked synergistically with growth to produce more optimal changes in mandibular position.
Highlights
- •
Cervical headgear controls the vertical dimension better than high-pull headgear.
- •
Cervical headgear produces more favorable changes in mandibular position.
- •
Cervical headgear and growth produce desirable changes in mandibular position.
The use of headgear dates back to 1892 when William Kingsley advocated the use of extraoral anchorage to obtain a Class I molar relationship. It was not until the 1950s that the cervical headgear of Kloehn came into common use. In 1957, Ricketts showed downward and forward rotation of the occlusal plane, whereas the palatal plane and the maxillary complex rotated in a clockwise direction. In his follow-up article on cervical headgear, Ricketts stated that cervical headgear controls the extrusion of the maxillary molars. The soft tissue change was also favorable, with the upper lip moving back with the maxillary complex and therefore preventing excess gingival display in the anterior. Contrary to what was shown by Kloehn and Ricketts, some clinicians doubt the efficacy of cervical headgear. The force that the cervical headgear places on the dentition can result in extrusion of the maxillary molars. Others have stated that extrusion of the maxillary molars leads to downward and backward rotation of the mandible to accommodate the maxillary teeth, resulting in worsening of the facial profile. Opponents of cervical headgear have also claimed to see severe relapse of Class II patients, second molar impactions, ectopic eruption of second molars, overextrusion of maxillary incisors, and torque issues in both maxillary and mandibular incisors, which have been called the “Kloehn reaction.”
Root and Watson , using high-pull headgear combined with the J-hook for controlling vertical dimensions successfully demonstrated vertical control of molars with 600 to 1000 g of force of the headgear worn 18 to 22 hours a day. The high-pull headgear was set up with a short outer bow with the line of action going through the center of resistance of the maxillary first molar.
The implant study of Bjork and Skieller showed that growth of the maxilla is in downward and forward directions, and also displays forward rotation resulting in an increased vertical height at the posterior molars. This increase in height at the maxillary molars causes interference with the mandibular molars and forward positioning of the mandible. Together, these actions result in flattening of the occlusal plane. It has even been suggested that the increase in the vertical dimension in the posterior dentition and the forward repositioning of the mandible result in a stimulus for the condyle to grow to allow the mandible to function in a more functional position. When there are changes in the structure and therefore the function of the oral system, the growth of the condyle and the mandible is affected. This has been shown in studies where occlusal function was altered in monkeys by placing a piece of plastic between the premolars. This altered occlusal function created an artificial axis point and changed the growth of the mandible. Evidence in humans that the occlusal relationship alters growth and development was shown in a study by Fushima et al, who compared 50 cephalometric radiographs of women with a Class II Division 1 malocclusion with radiographs of a similar group of women who had Class I occlusion. They found a correlation between the cant of the posterior occlusal plane and the inclination of the maxillary molars. The steeper the posterior occlusal plane, the more distally inclined were the molars. Further evidence can be found in a 2008 study by Tanaka and Sato. They gathered cephalometric radiographs from 102 untreated subjects at 3 times. These subjects were split into groups based on their malocclusion classification of Class I, Class II, or Class III. They also split the conventional occlusal plane into anterior and posterior segments just as the previously mentioned study did. They found that in all 3 groups the occlusal plane tended to become more horizontal with growth. No significant difference between the groups was seen when the angle of the anterior occlusal plane or the conventional occlusal plane to Frankfort horizontal was measured. They did find significant differences when the posterior occlusal plane was measured from the Frankfort horizontal. Subjects with Class II malocclusions had steeper posterior occlusal planes than did their Class I and Class III counterparts. This shows that the cant of the posterior occlusal plane is closely related to the development of a Class II, Class I, or Class III malocclusion. Some authors have suggested in treatment of Class II malocclusions that it is best to use techniques that work with development to encourage correct mandibular adaptation and growth. Because of the correlation between high-angle Class II malocclusions and a steep posterior occlusal plane and a short vertical height at the maxillary second molar, the ideal treatment would be to level the occlusal plane and extrude the maxillary molars.
The goal of this study was to compare the effects of occlusal plane control caused by cervical and high-pull headgear on the vertical dimensions (face typology and mandibular growth direction) in Class II Division 1 patients with hyperdivergent face typology. There were 3 hypotheses tested: (1) there is no statistically significant mean difference in vertical dimension changes between cervical headgear and high-pull headgear during phase 1 treatment of growing skeletal Class II subjects, (2) there is no statistically significant mean difference in vertical dimension changes after phase 1 treatment with cervical headgear compared with normal growth measurements, and (3) there is no statistically significant mean difference in vertical dimension changes after phase 1 treatment with high-pull headgear compared with normal growth measurements.
Material and methods
This study was approved by the Institutional Review Board (number 2013-1148) at the University of Illinois at Chicago. We randomly recruited 80 patients from 2 distinct orthodontic practices having records before treatment (T1) and at the end of phase 1 (T2). One practice used only cervical headgear and the other used high-pull headgear. After our exclusion criteria were applied, the sample for this study included 41 white subjects with a Class II Division 1 malocclusion who received treatment with cervical (n = 22) or high-pull (n = 19) headgear and no other appliances. The subjects had a facial convexity of 4 mm or more, a facial axis of 90° or less, and a Ricketts total facial height of 57° or more. Subjects were excluded if they had any other occlusion, missing records, or craniofacial anomalies. The 19 subjects who received treatment with high-pull headgear were on average 9.4 ± 2.5 years of age. They were instructed to wear the appliance full time (at least 10-18 hours daily) with 550 to 600 g of force per side with the outer bow parallel to the inner bow and the end positioned anterior to the first molar. The 22 subjects who received treatment with cervical headgear were 8.6 + 2.5 years at the start of treatment and were instructed to wear their headgear 8 to 10 hours per day with 450 g of force per side with the outer bow angled up 30° from the inner bow. The end of the outer bow was positioned posterior to the first molar. The average headgear wear in both groups was 1 year (10 ± 2 month) as phase 1 treatment.
T1 and T2 radiographs of the subjects who had undergone Class II Division 1 correction with cervical or high-pull headgear were scanned and uploaded into Dolphin software (version 11.0; Dolphin Imaging and Management Solutions, Chatsworth, Calif) and calibrated using the ruler in the radiograph. The transfer structures method by means of fiducials and anatomic best-fit structures was used to ensure the most accurate tracing possible and minimize landmark identification errors. Once all structures were transferred successfully, each radiograph was oriented so that the Frankfort horizontal line was perpendicular to the true vertical. This was done for all subjects at T1 and T2. Fifteen cephalometric variables were analyzed as part of the study.
Statistical analysis
The principal investigator (E.D.Z.) was tested for intrareliability by tracing 10 cephalometric radiographs as described previously. The investigator then traced the same 10 radiographs 2 weeks later. All 15 variables were tested for reliability. Interreliability was determined by comparing variables from the 10 radiographs traced by the investigator to the same variables from radiographs traced by a faculty member (B.K.) of the Department of Orthodontics at the University of Illinois at Chicago. Intraclass correlations were estimated to determine the intrarater and interrater reliabilities of each variable in the study method. The data analysis is reported using the Student paired-samples t test and the independent t test. Because the Shapiro-Wilk normality test results indicated that the raw data for a few variables were not distributed on a normal curve, corresponding nonparametric tests were run for those variables as well. Similar results were found with parametric and nonparametric tests, so the parametric data analyses were reported for all variables. Statistical significance was set at 0.05.
Data analysis was done with SPSS Statistics for Windows (version 22; IBM, Armonk, NY).
Results
Descriptive statistics were computed for all variables. The Shapiro-Wilk test showed that most variables had a normal distribution. At T1, all 15 variables were tested using the independent-samples t test. The only variable that showed a significant difference between the 2 treatment groups was ramus height (Ar-Go), with the high-pull headgear group having a 3.18-mm higher mean ( P = 0.021). One variable, facial angle (FH-NPo), displayed a borderline statistically significant mean difference at P = 0.055. The high-pull group had on average a 1.55° higher facial angle. For the most part, the independent t tests showed similarity between the cervical headgear group and the high-pull headgear group at T1 ( Table I ).
| Variable | Group | |||||
|---|---|---|---|---|---|---|
| Cervical, n = 22 | High pull, n = 19 | Mean difference | P value | |||
| Mean | SD | Mean | SD | |||
| Maxillary depth (FH-NA) (°) | 92.16 | 3.45 | 93.09 | 2.48 | −0.93 | 0.334 |
| Convexity (A-NPo) (mm) | 6.90 | 2.88 | 6.40 | 2.08 | 0.50 | 0.530 |
| Facial axis (NaBa-PtGn) (°) | 83.94 | 3.17 | 84.77 | 2.85 | −0.83 | 0.385 |
| Facial angle (FH-NPo) (°) | 84.93 | 2.62 | 86.48 | 2.36 | −1.55 | 0.055 ∗ |
| Facial height (NaBa-XiPm) (°) | 63.55 | 4.08 | 63.87 | 3.29 | −0.33 | 0.78 |
| Mandibular arc (°) | 28.50 | 4.68 | 27.58 | 5.14 | 0.92 | 0.553 |
| Occlusal plane (OP-FH) (°) | 10.22 | 2.42 | 9.03 | 3.66 | 1.19 | 0.221 |
| FMA (MP-FH) (°) | 29.49 | 3.69 | 28.51 | 3.01 | 0.98 | 0.361 |
| U6 to SN (°) | 64.69 | 4.60 | 67.11 | 3.29 | −2.42 | 0.063 |
| Ramus height (Ar-Go) (mm) | 36.51 | 4.31 | 39.69 | 4.17 | −3.18 | 0.021 † |
| Palatal plane inclination ANS-PNS to FH) (°) | 2.76 | 2.81 | 3.73 | 3.98 | −0.97 | 0.369 |
| Posterior facial height (Go-CF) (mm) | 54.05 | 5.23 | 56.44 | 4.68 | −2.39 | 0.134 |
| U6 to PTV (mm) | 12.62 | 3.22 | 13.03 | 3.26 | −0.40 | 0.693 |
| U6 to PP (mm) | 17.80 | 1.80 | 18.80 | 2.35 | −1.00 | 0.132 |
| L6 to MP (mm) | 31.98 | 2.42 | 31.60 | 3.15 | 0.38 | 0.668 |
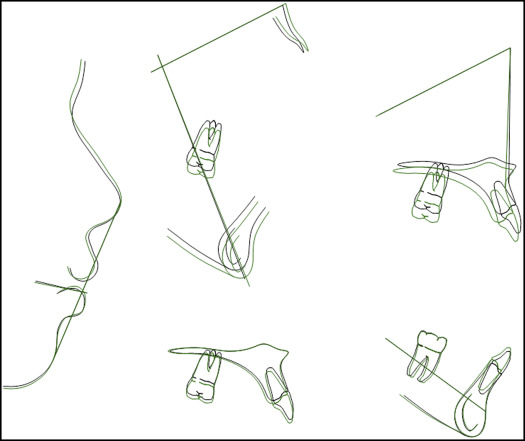
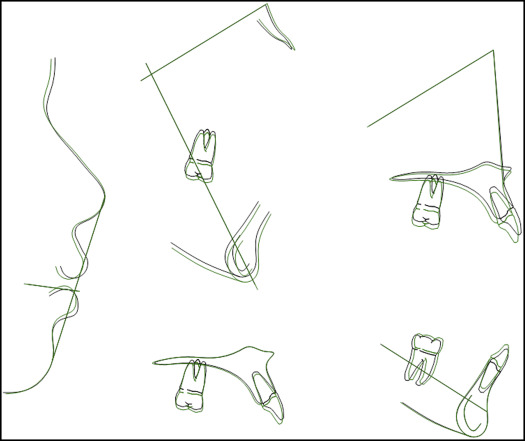
The paired-samples t test was used to compare the mean difference between T1 and T2 for each variable in each treatment group. In the cervical headgear group, 11 of 15 variables showed significant mean differences. Facial axis, facial angle, posterior facial height, posterior ramus, palatal plane inclination, distance from the maxillary first molar to the sella-nasion line distance from the maxillary first molar to pterygoid vertical (PTV), and extrusion of the maxillary first molar to the palatal plane all increased ( Fig 1 ). At the same time, convexity, inclination of the occlusal plane, and Frankfort-mandibular plane angle decreased ( Table II ). In the high-pull headgear group, the variables that showed statistically significant changes included the decrease in palatal plane inclination, the increase in posterior facial height, the extrusion of the maxillary first molar to the palatal plane, and the extrusion of the mandibular first molar to the mandibular plane ( Fig 2 ; Table III ).
| Variable | Mea difference | SD | 95% CI | df | P value | |
|---|---|---|---|---|---|---|
| Lower | Upper | |||||
| Maxillary depth (FH-NA) (°) | −0.32 | 2.10 | −1.25 | 0.61 | 21 | 0.485 |
| Convexity (A-NPo) (mm) | −1.84 | 1.94 | −2.70 | −0.98 | 21 | 0.000 ∗ |
| Facial axis (NaBa-PtGn) (°) | 1.04 | 1.74 | 0.26 | 1.81 | 21 | 0.011 ∗ |
| Facial angle (FH-NPo) (°) | 1.82 | 1.70 | 1.06 | 2.57 | 21 | 0.000 ∗ |
| Facial height (°) | −0.52 | 1.79 | −1.31 | 0.27 | 21 | 0.184 |
| Mandibular arc (°) | 0.70 | 3.73 | −0.96 | 2.35 | 21 | 0.391 |
| Occlusal plane (OP-FH) (°) | −2.18 | 2.47 | −3.27 | −1.09 | 21 | 0.000 ∗ |
| FMA (MP-FH) (°) | −1.13 | 1.69 | −1.88 | −0.38 | 21 | 0.005 ∗ |
| U6 to SN (°) | 3.20 | 4.66 | 1.14 | 5.27 | 21 | 0.004 ∗ |
| Ramus height (Ar-Go) (mm) | 2.53 | 2.68 | 1.34 | 3.72 | 21 | 0.000 ∗ |
| Palatal plane inclination (ANS-PNS to FH) (°) | 0.94 | 1.90 | 0.09 | 1.78 | 21 | 0.031 ∗ |
| Posterior facial height (Go-CF) (mm) | 2.20 | 2.70 | 1.00 | 3.39 | 21 | 0.001 ∗ |
| U6 to PTV (mm) | 1.64 | 2.82 | 0.39 | 2.89 | 21 | 0.013 ∗ |
| U6 to PP (mm) | 1.73 | 1.32 | 1.15 | 2.32 | 21 | 0.000 ∗ |
| L6 to MP (mm) | −0.65 | 2.25 | −1.65 | 0.35 | 21 | 0.190 |
| Variable | Mean difference | SD | 95% CI | df | P value | |
|---|---|---|---|---|---|---|
| Lower | Upper | |||||
| Maxillary depth (FH-NA) (°) | −0.54 | 1.54 | −1.28 | 0.21 | 18 | 0.147 |
| Convexity (A-NPo) (mm) | −0.51 | 1.41 | −1.19 | 0.18 | 18 | 0.136 |
| Facial axis (NaBa-PtGn) (°) | 0.00 | 1.14 | −0.55 | 0.55 | 18 | 1.000 |
| Facial angle (FH-NPo) (°) | 0.21 | 1.10 | −0.32 | 0.74 | 18 | 0.426 |
| Facial height (mm) | −0.23 | 1.35 | −0.88 | 0.42 | 18 | 0.465 |
| Mandibular arc (°) | 0.85 | 2.78 | −0.49 | 2.19 | 18 | 0.198 |
| Occlusal plane (OP-FH) (°) | 0.28 | 2.28 | −0.81 | 1.38 | 18 | 0.593 |
| FMA (MP-FH) (°) | −0.08 | 1.89 | −1.00 | 0.82 | 18 | 0.838 |
| U6 to SN (°) | 1.33 | 3.30 | −0.26 | 2.92 | 18 | 0.096 |
| Ramus height (Ar-Go) (mm) | 0.95 | 2.81 | −0.40 | 2.31 | 18 | 0.156 |
| Palatal plane inclination ANS-PNS to FH) (°) | −1.30 | 1.71 | −2.12 | −0.47 | 18 | 0.004 ∗ |
| Posterior facial height (Go-CF) (mm) | 1.74 | 2.00 | 0.77 | 2.70 | 18 | 0.001 ∗ |
| U6 to PTV (mm) | 0.37 | 1.93 | −0.55 | 1.30 | 18 | 0.409 |
| U6 to PP (mm) | 1.14 | 1.01 | 0.64 | 1.65 | 18 | 0.000 ∗ |
| L6 to MP (mm) | 1.14 | 1.50 | 0.42 | 1.86 | 18 | 0.004 ∗ |
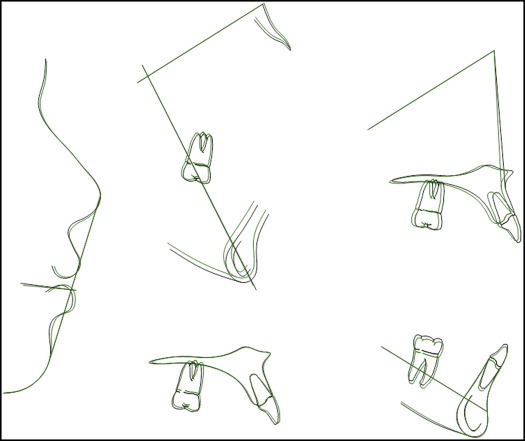
To assess the effect of growth on the variables after phase 1 treatment, the variables of both groups at T2 were compared with the values generated from the growth predictions of Ricketts, programmed into the Dolphin software ( Fig 3 , Table IV ). For the cervical group, the variables with statistically significant changes from T1 to T2 that could be attributed to normal growth and not to the cervical headgear included the increases in facial axis, ramus height, and distance from the maxillary first molar to PTV ( Fig 4 ; Table V ). The variables with statistically significant changes from T1 to T2 and at the same time that displayed greater changes than would be expected from normal growth included the increase in facial angle and the decrease in the angle of the occlusal plane to the Frankfort horizontal and the mandibular plane angle. Interestingly, the statistically significant decrease in convexity from T1 to T2 was less than would have been expected if it was the result of the subjects’ normal growth. The 2 variables that did not show statistical differences from T1 to T2 and were not statistically different from normal growth at T2 were maxillary depth and mandibular arc. Similar comparisons were made for the group treated with high-pull headgear, and only the increase in the distance from the maxillary first molar to PTV was significantly less than would have been expected with normal growth ( Fig 5 ).
| Group | Variable | Mean difference | SD | 95% CI | df | P value | |
|---|---|---|---|---|---|---|---|
| Lower | Upper | ||||||
| Cervical | Convexity | −1.83 | 2.61 | −2.99 | −0.67 | 21 | 0.004 ∗ |
| Facial angle | 1.53 | 2.31 | 0.50 | 2.55 | 21 | 0.005 ∗ | |
| Occlusal plane | 0.66 | 2.03 | −3.66 | −1.86 | 21 | 0.000 ∗ | |
| FMA | −1.88 | 3.60 | −3.48 | −0.29 | 21 | 0.023 ∗ | |
| High-pull | U6 to PTV | −2.46 | 4.39 | −4.58 | −0.34 | 18 | 0.025 ∗ |
Stay updated, free dental videos. Join our Telegram channel
VIDEdental - Online dental courses


