Introduction
The aim of this study was to compare 3-dimensional landmark consistency and precision in skeletal structures in groups with different levels of experience with 2-dimensional cephalometrics.
Methods
Sixteen observers, all undergraduate or graduate students, were divided into 4 groups with different levels of experience in 2-dimensional landmarking and no previous experience in 3 dimensions. Group 1 consisted of 4 third-year dental students with no experience in cephalometric landmarking. Groups 2, 3, and 4 consisted of first-, second-, and third-year graduate students, with increasing levels of experience. The participants located 18 landmarks in 12 surface models of cone-beam computed tomography scans of patients on 3 separate occasions. The average of all examiners locating each landmark was defined as the centroid. The mean of the distances of each located point to the centroid of that landmark was used as the mean consistency (MC), and the standard deviation (SD) was used as the precision. Analysis of variance and post hoc Tukey comparisons between groups were done.
Results
The MC and SD values across landmarks, patients, and examiners were 1.03 ± 1.14 mm. The MC and SD were 0.89 ± 0.83 mm for group 1 with no experience, 1.02 ± 0.95 mm for group 2, 1.17 ± 1.60 mm for group 3, and 1.05 ± 1.00 mm for group 4. Significant differences were found among the groups.
Conclusions
Comparing the observer groups studied, the undergraduate dental school students without previous experience in bidimensional cephalometrics obtained the best values in volumetric landmark location. Graduate students with increasing amounts of experience did not perform as well. These results and conclusions should be interpreted with caution because the number of subjects in each group was small.
Highlights
- •
Experience with traditional cephalometric tracings adversely affects 3D landmarking.
- •
Subjects without experience in 2D cephalometrics were better at 3D landmarking.
Cephalometric analysis is an essential method of diagnosis in the study of malocclusions and an important tool in communication between dental professionals. These analyses have been standardized to determine growth and treatment of patients. Traditionally, lateral and frontal radiographs have been used to perform these analyses for identifying craniofacial discrepancies and deformities based on a series of cephalometric landmarks. With the introduction of 3-dimensional (3D) images, deficiencies in traditional 2-dimensional (2D) radiography have been eliminated. These include magnification, distortion, and errors in patient head positioning that must be added to the inherent deviations when locating landmarks.
Research of 3D landmark precision began with spiral or helical computed tomography and is slowly being implemented in cone-beam computed tomography (CBCT) in the dental profession. Both technologies make 3D reconstruction and visualization of a patient’s craniofacial complex possible. The later appearance of CBCT also allows greater access, smaller equipment, lower levels of radiation, and lower costs than those incurred in computed tomography. The geometric precision of CBCT images has been assessed and confirmed in several studies, and it has been determined that 2D reconstructions from CBCT have a similar image quality as conventional x-rays.
Placing landmarks is a common diagnostic test used by orthodontists to be able to analyze 2D images and determine a diagnosis and treatment plan for a patient. This technique is learned during the undergraduate years and is applied as a gold standard for treating orthodontic patients. With the advent of 3D images, diagnosis and treatment planning of patients is expected to be more effective and accurate, since these images do not have the disadvantages of traditional 2D images. In the literature, no diagnostic analyses were found similar to the traditionally used cephalometric analysis for 3D images. Although several studies have presented new landmarks for use in CBCT imaging, the application of these still depends on the experience of the dentist in handling CBCT images.
To our knowledge, no studies have been published about the effect of locating landmarks in 3D images depending on the dentists’ previous experience in using 2D images. The hypothesis is that people with no experience with 2D radiographs would have better landmark placement in 3D images compared with those with previous 2D experience. Therefore, the purpose of this study was to compare landmark consistency and precision in skeletal structures in groups with different levels of previous experience with 2D images. In other words, the focus was to verify whether observers would have better consistency in identifying landmarks in 3D images without the use of multiplanar rendered images (flat 2D images) depending on their past experience in traditional 2D cephalometry. This would be the first step in understanding the usefulness of these images when communicating with other professionals, parents, or patients.
Material and methods
Approval from the ethics committee of Rey Juan Carlos University, Madrid, Spain, was obtained. Twelve CBCT images were used (from 7 boys and 5 girls, 7.9-15.3 years of age) from patients who attended the university clinic and required orthodontic treatment between March 2010 and March 2011. These patients were nonsyndromic and could be in the mixed or permanent dentition. No restriction on malocclusions or dental relationships was applied.
CBCT scans had been taken for various clinical reasons to aid in diagnosis, and informed consent was obtained from the patients to participate in this study. The imaging procedure was carried out using the same protocol for patient positioning to minimize errors caused by different head postures.
The patient group came from a larger database (35 in total) according to the following exclusion criteria: cleft lip/palate, supernumerary teeth, agenesis of an incisor or a permanent first molar, anatomic anomaly, severe asymmetry, or skeletal dysplasia, as well as patients who were eligible for orthognathic or bone graft surgery, those with previous orthodontic treatment, or those using a prosthetic denture or a dental splint. Three scans were also excluded from our study because they had double imaging caused by the patients’ movements during scanning.
Scans were obtained using the Vatech Picasso 3D Master (E-WOO Technology, Yongin, Korea). The parameters used during the exposure were 90 kVp and 2.8 to 3.4 mA (2.8 mA for patients up to 10 years inclusive, and 3.4 mA for older patients). Scan time was 24 seconds with a field of view of 20 × 19 cm, capturing the whole maxillofacial structure. The resolution of the volume obtained was a voxel size of 300 μm. The protocol for head positioning was comparable with that used by Broadbent and Cho. This was carried out by a radiology technician who seated each patient in an upright position and then secured the forehead, leaving the chin free. Coronally, the bipupilar line was parallel to the floor. Data sets were exported in DICOM format, thus allowing the results to be visualized using the InVivo5 software (Anatomage, San Jose, Calif). Reorientation of patients’ volumetric images, controlling pitch, roll, and yaw, consisted in positioning from a sagittal view the right Frankfort horizontal plane (plane passing through porion and right orbitale) and from a frontal view the nasion-frontozygomatic plane (passing through the 2 frontozygomatic sutures and nasion), both parallel to the floor (using the upper and lower edges of the computer screen).
Sixteen observers were selected and divided into 4 groups with an equal number of participants. Each group had a different level of knowledge and experience in 2D cephalometric tracing, and no group had previous contact with CBCT images (3D cephalometrics). Group 1 consisted of 4 students in the third year of undergraduate dental school with no 2D cephalometric experience. Groups 2, 3, and 4 consisted of students in the first, second, and third years of an orthodontic postgraduate program, respectively (each with different experience in cephalometric tracing: group 2 had the least experience, and group 4 had the most experience). All participants were students at the University Rey Juan Carlos in Madrid (Spain).
Calibration for the study was done by having all participants locate landmarks on a complete test case on a rendered 3D DICOM model labeled as patient 0. This patient met the same inclusion criteria as the 12 study scans included in this study. Training in using the software and calibration in the theoretical and operational definitions of the landmarks to be identified were the same for the 4 groups. This allowed all observers to start from a basic common ground.
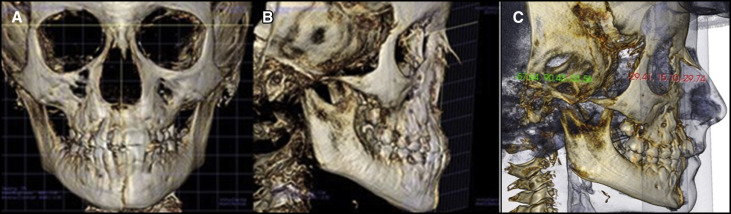
The CBCT scans were anonymized. Each series of landmarks was located on 3 separate occasions (leaving at least 3 days and a maximum of 3 weeks between tracings). Eighteen landmarks were to be located ( Fig 1 ) using only the volumetric images (3D surface models), without the multiplanar reformation (MPR) images such as axial, coronal, and sagittal slices. The time spent with each image was not taken into account. Figure 1 illustrates 2 types of images on which the landmarks were identified.
Operational definitions of 3D landmarks were given to all participants ( Table I ). They were allowed to use the tools in the software to improve the visualization of the images (zoom, contrast, brightness, and opacity). They could also remove certain bone structures that interfered with the identification of some anatomic landmarks. Table II shows the order in which landmarks were to be identified. A protocol was followed to ensure that there were no errors when registering the data. Since the objective was to compare the consistency in identifying landmarks in 3D images, we emphasized to the observers to use the 3D reconstruction of the image and not the MPR rendering cutoff. This was because using the MPR would definitely give us more precise landmarks, which was not the major objective of this study. According to this methodology, we wanted to evaluate what kind (with and without 2D cephalometry experience) of observers are better at locating landmarks depending on their traditional tracing experience.
| Skeletal landmarks | |
|---|---|
| Frontozygomatic (FZ) | Most external point of frontozygomatic suture |
| Nasion (N) | Most anterior and medial point of the frontonasal suture |
| Orbitale (Or) | Lowest point in the inferior margin of the orbit |
| Anterior nasal spine (ANS) | Tip of the anterior nasal spine |
| Menton (Me) | Most inferior midline point on the mandibular symphysis |
| Porion (Po) | Superior point of the external auditory meatus |
| Glenoid fossa (Gf) | Most superior point of the glenoid fossa |
| Articular eminence (Ae) | Lowest point of articular eminence of the temporal bone |
| Gonion (Go) | Intermediate point on the curve of the angle of the jaw where the branch and the mandibular body unite, constructed point of intersection of the ramus plane and the mandibular plane |
| Mental foramen (Mf) | Central point of the mental foramen on the buccal surface of the mandible |
| Coronoid process (Cp) | Tip of the mandibular coronoid process |
| Landmark | Undergraduate dental school | First year of master postgraduate | Second year of master postgraduate | Third year of master postgraduate | ||||||||||||
|---|---|---|---|---|---|---|---|---|---|---|---|---|---|---|---|---|
| MC (mm) | SD (mm) | Min (mm) | Max (mm) | MC (mm) | SD (mm) | Min (mm) | Max (mm) | MC (mm) | SD (mm) | Min (mm) | Max (mm) | MC (mm) | SD (mm) | Min (mm) | Max (mm) | |
| FZ-R | 0.50 | 0.25 | 0.12 | 1.12 | 0.42 | 0.23 | 0.11 | 1.32 | 0.42 | 0.28 | 0.04 | 1.44 | 0.57 | 0.30 | 0.16 | 1.55 |
| N | 0.46 | 0.35 | 0.09 | 1.79 | 0.48 | 0.43 | 0.08 | 2.09 | 0.48 | 0.30 | 0.09 | 1.62 | 0.50 | 0.43 | 0.11 | 2.42 |
| FZ-L | 0.46 | 0.28 | 0.10 | 1.43 | 0.36 | 0.23 | 0.05 | 1.23 | 0.35 | 0.27 | 0.12 | 1.76 | 0.45 | 0.24 | 0.10 | 1.10 |
| Or-R | 1.07 | 0.85 | 0.16 | 3.93 | 2.31 | 1.24 | 0.28 | 5.28 | 3.07 | 3.54 | 0.27 | 12.14 | 1.35 | 0.69 | 0.11 | 3.47 |
| Or-L | 0.89 | 0.50 | 0.14 | 2.08 | 2.05 | 1.32 | 0.33 | 5.24 | 3.45 | 3.41 | 0.20 | 11.73 | 1.29 | 0.89 | 0.24 | 4.14 |
| ANS | 0.77 | 0.48 | 0.25 | 2.30 | 0.83 | 0.53 | 0.06 | 2.67 | 0.85 | 0.55 | 0.21 | 3.03 | 1.04 | 0.97 | 0.15 | 5.68 |
| Me | 0.88 | 0.44 | 0.14 | 2.30 | 0.88 | 0.63 | 0.06 | 3.15 | 1.09 | 0.49 | 0.36 | 2.73 | 1.32 | 1.12 | 0.11 | 4.46 |
| Po-R | 1.34 | 1.09 | 0.15 | 5.01 | 1.61 | 1.59 | 0.26 | 7.78 | 1.65 | 1.79 | 0.18 | 8.62 | 1.56 | 1.13 | 0.05 | 4.44 |
| Gf-R | 1.20 | 1.74 | 0.11 | 12.03 | 1.38 | 0.84 | 0.22 | 3.96 | 1.08 | 0.97 | 0.18 | 6.77 | 1.33 | 0.81 | 0.09 | 3.14 |
| Ae-R | 0.98 | 0.92 | 0.06 | 5.14 | 0.92 | 0.73 | 0.08 | 3.20 | 0.78 | 0.46 | 0.19 | 2.21 | 1.03 | 1.11 | 0.14 | 6.60 |
| Go-R | 1.65 | 0.99 | 0.12 | 4.60 | 1.26 | 0.73 | 0.30 | 3.34 | 1.37 | 0.88 | 0.15 | 3.61 | 1.23 | 0.74 | 0.14 | 3.01 |
| Mf-R | 0.72 | 0.95 | 0.05 | 4.33 | 0.77 | 0.92 | 0.08 | 4.20 | 0.82 | 0.97 | 0.14 | 4.31 | 0.97 | 1.88 | 0.08 | 10.81 |
| Po-L | 1.02 | 0.71 | 0.11 | 3.42 | 1.25 | 0.87 | 0.20 | 4.97 | 0.90 | 0.88 | 0.13 | 4.44 | 1.31 | 1.06 | 0.19 | 4.92 |
| Gf-L | 0.69 | 0.51 | 0.08 | 2.05 | 0.76 | 0.45 | 0.19 | 1.79 | 0.84 | 0.58 | 0.22 | 3.05 | 0.98 | 0.69 | 0.10 | 2.94 |
| Ae-L | 0.72 | 0.60 | 0.12 | 3.20 | 0.58 | 0.34 | 0.14 | 1.87 | 0.60 | 0.49 | 0.15 | 2.72 | 1.00 | 0.96 | 0.12 | 6.07 |
| Go-L | 1.26 | 0.81 | 0.10 | 3.28 | 0.94 | 0.66 | 0.12 | 2.97 | 1.83 | 1.24 | 0.18 | 4.81 | 1.67 | 1.29 | 0.18 | 5.44 |
| Mf-L | 0.49 | 0.39 | 0.07 | 1.90 | 0.49 | 0.31 | 0.07 | 1.39 | 0.53 | 0.34 | 0.08 | 1.80 | 0.48 | 0.35 | 0.07 | 1.80 |
| Cp-L | 0.89 | 0.57 | 0.13 | 2.90 | 1.08 | 0.58 | 0.11 | 2.48 | 0.96 | 0.61 | 0.21 | 3.04 | 0.89 | 0.82 | 0.16 | 4.36 |
| Total | 0.89 | 0.83 | 0.05 | 12.03 | 1.02 | 0.95 | 0.05 | 7.78 | 1.17 | 1.60 | 0.04 | 12.14 | 1.05 | 1.00 | 0.05 | 10.81 |
Stay updated, free dental videos. Join our Telegram channel
VIDEdental - Online dental courses


