11
Predicting and Managing Surgical Intervention in Craniofacial – Disharmony a Biomechanical Perspective
Predicting the outcome of orthognathic surgery is challenging in that the hard and soft tissues changes in the face require simulation, and these changes are dependent on the surgeon being able to carry out the surgical plan within an overall mean surface error of less than 2 mm.1 The period of treatment is often in excess of 2 years, during which the individual’ s face is continually maturing. The facial contours continue to change after surgery as the facial swelling reduces. 2 Therefore simulation of facial changes should ideally reflect a combination of maturation and surgical change.
As a result of the long treatment duration, individuals are subject to changes in fashion – clothes, hairstyles, and cosmetic influences – and it is important when evaluating facial change that these factors are minimized. Another challenge is the reproducibility of color images. The quality of these depends on many factors, such as ambient light/lighting, ambient room temperature, quality of the lenses, film, or digital capture screens, as well as changes to surface facial topography and its interaction (lines of light incidence and reflection) with the aforementioned factors. Therefore, it is important also to evaluate the surface changes using standardized conditions.
The use of three- dimensional (3D) imaging has enabled valid and accurate capture of the facial contours, enabling the superimposition of a photorealistic texture in static and dynamic modes. This is an important advancement in evaluating surgical change as we can see change in soft tissues as a result of movement relative to a standardized framework and origin. We consider this to be a more valid measure of assessment of surgical change compared with static images as we see differences as a result of function, and this function is less likely to be influenced by awkward posing by individuals.
Both orthodontists and maxillofacial surgeons have sought to develop methods to predict surgical change in individuals with craniofacial disharmony using lateral cephalograms,3 photographs,4 videoimaging,5 and multivariate analyses.6 However, in spite of efforts to provide a detailed predictive plan, the outcome often falls short of reality.7
These errors may be minimized by:
- A full characterization of the facial features. Each face contains subtle differences that make the appearance unique, and it is important to characterize these features. For example, the lips may show significant variation in lip morphology (Figure 11.1).
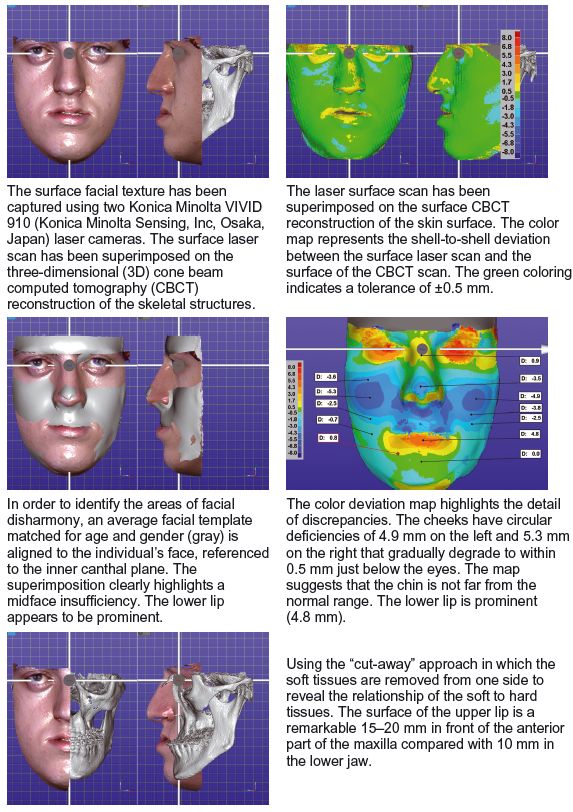
- Taking into account detail of the relationship of the various soft tissues to the underlying skeletal structures. The relationship of soft tissues to underlying skeletal structures is widely variable, and this is highlighted by a significant amount of soft tissue being present anterior to the maxilla compared with the mandible (Figure 11.2).
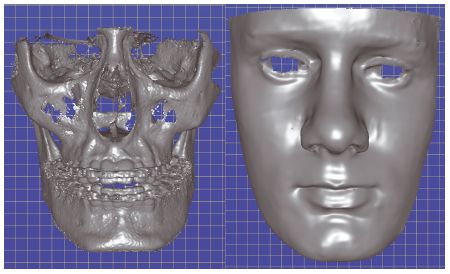
- Carrying out a full assessment of horizontal and vertical asymmetry. The assessment of asymmetry should be taken with respect to the individual’ s natural head posture. Figure 11.3 shows a vertical discrepancy between the left and right eyes, and a horizontal discrepancy with the mandibular centerline 6 mm to the left.
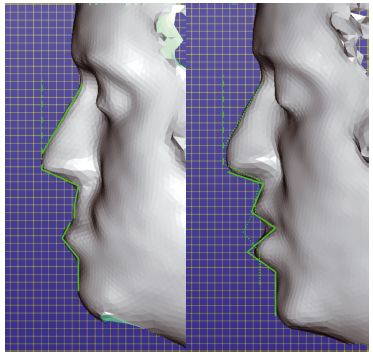
- An appreciation that the face moves during function (Figure 11.4).8-10 Previous publications have concentrated on the static imaging of individuals with craniofacial disharmony, but recent advances have facilitated 3D dynamic capture of the facial soft tissues. This enables an evaluation of soft tissue movements prior to and after surgical interventions. 8–10 An individual’ s face changes during function. This is illustrated particularly during speech. When at rest, the upper lip shows good length. However, during the utterance of “pup” in the word “puppy,” the upper lip appears much shorter
– the soft tissue profile changes are illustrated in Figure 11.4 using green surface markings. Ideally, functional movements should be utilized to simulate surgery for surgeons to plan procedures and for patients to understand and appreciate the likely surgical outcomes.
- Appreciating that each person is different, with a unique facial morphology, and as a consequence soft tissues will react differently depending on the detail of surgery planned (see Chapter 13).
- Mimicking the biologic structures using accurate biomechanical models. It is important to develop techniques that will accurately represent the biologic materials that make up the craniofacial complex.11-14
Figure 11.1 The lip morphology of these two individuals is different. (Left) The upper lip is well defined with a sharp cupid’s bow, and the lower lip is edged with a rolled border. (Right) The cupid’s bow is not well defined, with two halves clearly seen. There is a ridge 3 mm above and mimicking the vermillion border. The lower lip is everted, with a deep horizontal indent in the midline below the vermillion border. Similar amounts of skeletal surgical movement will result in differences in soft tissue changes as the lips have significant morphologic differences. (Screen images copyright Geomagic, Incorporated. Used with permission. All rights reserved.)
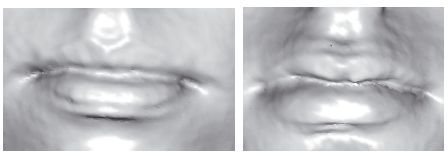
Figure 11.2 The relationship of the soft tissues (yellow) to the underlying skeletal structure. The images are taken from a cone beam computed tomography scan highlighting the complexity of the relationship of the upper and lower lips to the anterior part of the maxilla, the mandible, and each other. This picture has been created using AMIRA – a system for advanced visual data analysis (see http://www.amira.com/).
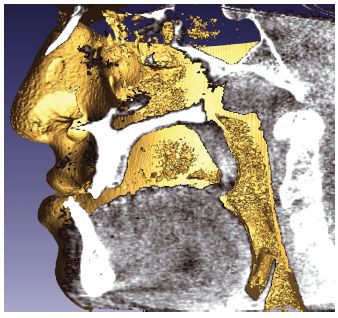
Figure 11.3 Assessment of asymmetry. The individual shows asymmetry in the skeletal and soft tissue, with the left eye inferiorly placed in comparison to the right eye. The mandibular centerline is also to the left. (Screen images copyright Geomagic, Incorporated. Used with permission. All rights reserved.)
The individual illustrated in Figure 11.5 attended the clinic expressing an interest in improving his facial appearance and reducing the prominence of his chin. Prior to surgery, full records were taken: facial photographs, cone beam computed tomography (CBCT) of the jaws, upper and lower dental impressions, and static and dynamic 3D laser surface images (Konica Minolta VIVID 910 and 3dMD, respectively; Konica Minolta Sensing Inc, Osaka, Japan). The laser surface scans were superimposed as best-fit onto the CBCT 3D construction of the skin surface. As CBCT and laser scans are not taken at the same time, there is always some degree of error in fit, usually less than 0.5 mm, due to some degree of facial posturing. The CBCT 3D reconstruction was adjusted to highlight the detail of the facial skeleton.
Figure 11.4 Assessment of the bilabial movement of an individual saying the syllable “pup” in “puppy.” Note the upper lip at rest (left) and when saying “pup” (right). (Screen images copyright Geomagic, Incorporated. Used with permission. All rights reserved.)
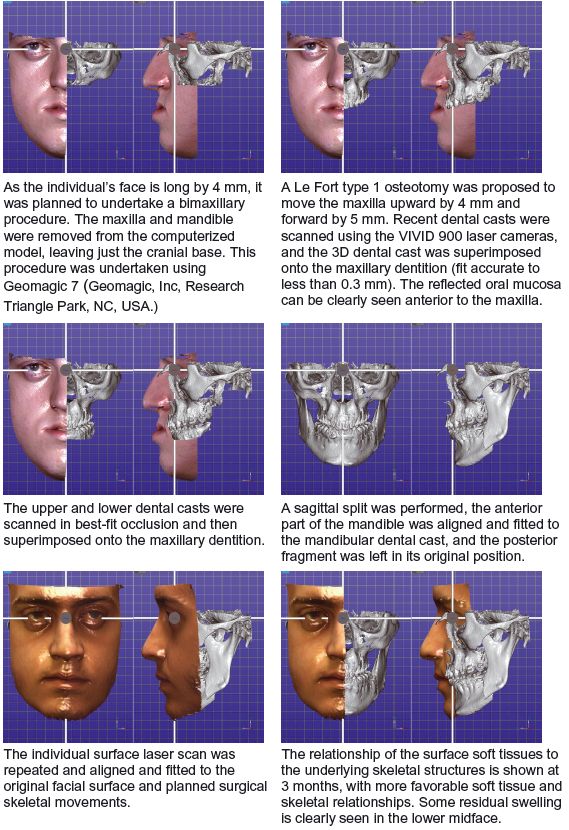
The sequence of procedures is outlined in Figure 11.5. With the surface scan and skeletal structures in the correct spatial relationship, these were then aligned to the horizontal plane based on the inner canthi and mid – sagittal planes (the origin being the mid – inner canthal point). To determine the soft tissue discrepancies, the average facial template (matched for gender and age) was fitted to the individual’ s face. The superimposition clearly identifies a midface insufficiency, and this can be quantified using a color deviation map. The midface is deficient by 4.9 – 5.3 mm. The lower face height is also increased by 4 mm. The “cut – away” approach was used whereby half the facial shell was removed to reveal the underlying skeletal structure.
A Le Fort type I osteotomy was performed, with the maxilla being moved upward by 4 mm and forward by 5 mm. The lower dental cast was scanned in the best -fit position to the upper dental cast, and the combined scans were best fitted to the denture of the CBCT with an accuracy of less than 0.3 mm. A sagittal split was performed on the mandible, and the CBCT of the lower denture was aligned to the lower dental cast by best-fit technique. This enabled the mandible to achieve the best possible fit with the maxilla.
Figure 11.5 Surgical procedure sequenced and assessment of outcome using color maps. (Screen images copyright Geomagic, Incorporated. Used with permission. All rights reserved.)
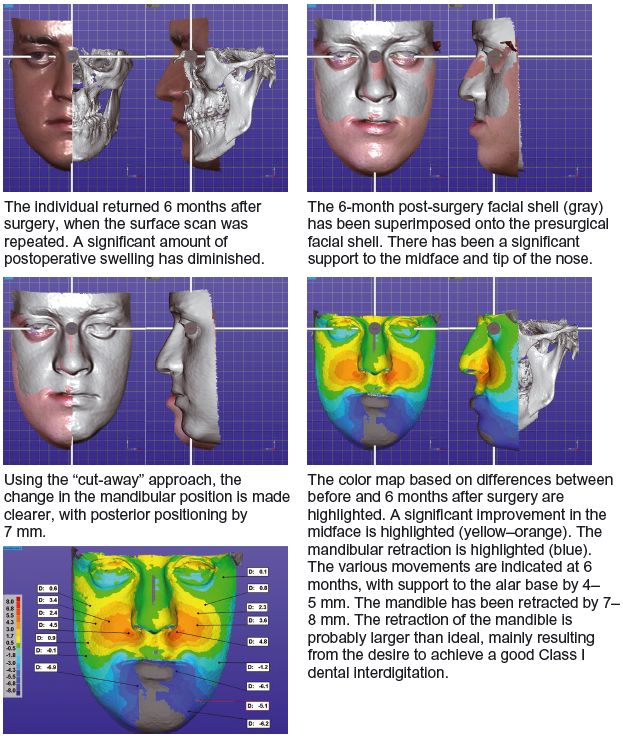
Using dynamic motion capture cameras, the individual was captured at rest and saying the word “puppy” prior to surgery and at 3- and 6- monthly intervals. The sequence of images clearly illustrates the facial features />
Stay updated, free dental videos. Join our Telegram channel
VIDEdental - Online dental courses


